Summary
A twelve-year field experiment at Waseca, Minnesota found a rotation of Peking with PI 88788 resistance is a good strategy for managing the soybean cyst nematode (SCN), and susceptible varieties and no-till may reduce pressure to select different SCN HG types.
Introduction
The soybean cyst nematode (SCN) is a major pathogen of soybean and has been widely spread in most soybean-producing regions in the world. The nematode has been found in most soybean fields in Minnesota. An exception is northwestern Minnesota where widespread soybean production is more recent. Growing resistant varieties and rotations with non-host crops have been major strategies to manage SCN [1, 2].
Effectiveness of using resistant varieties depends on the genetic interaction between the varieties and nematode populations. In the North Central Region, soybean is generally planted in annual rotation with corn, and most of the soybean fields are planted to SCN-resistant varieties. In addition, most of the commercial SCN-resistant soybean varieties in the region are derived from a single germplasm line PI 88788. Only a small portion of varieties are derived from the germplasm lines Peking (PI 548402) and others. The extensive use of SCN resistant varieties with limited sources of resistance has created a high selection pressure on SCN toward increased virulence to the resistant varieties.
Increase in virulence (the ability to parasitize and reproduce) of SCN to the sources of resistance or a change of races or HG Types, following the use of resistant soybean varieties has been demonstrated by a number of studies including state, regional, and national surveys in the USA and in greenhouse and field plot experiments. The selection pressure of resistant varieties on the pathogens may depend on the genetic interaction between the hosts and pathogens, and environments. Knowing the virulence phenotypes of SCN in fields and speed of change following the use of resistant varieties in different rotations is important for strategically deploying and breeding resistant varieties and making management recommendations.
A 12-year field plot experiment was conducted to study how growing commercially available SCN varieties carrying the PI 88788, Peking, and PI 437654 sources of resistance, as well as a susceptible variety either continuously or in rotation and how tillage affects SCN virulence phenotype and population density. Detailed descriptions of the study have been published in the journal Plant Disease [3].
Methods
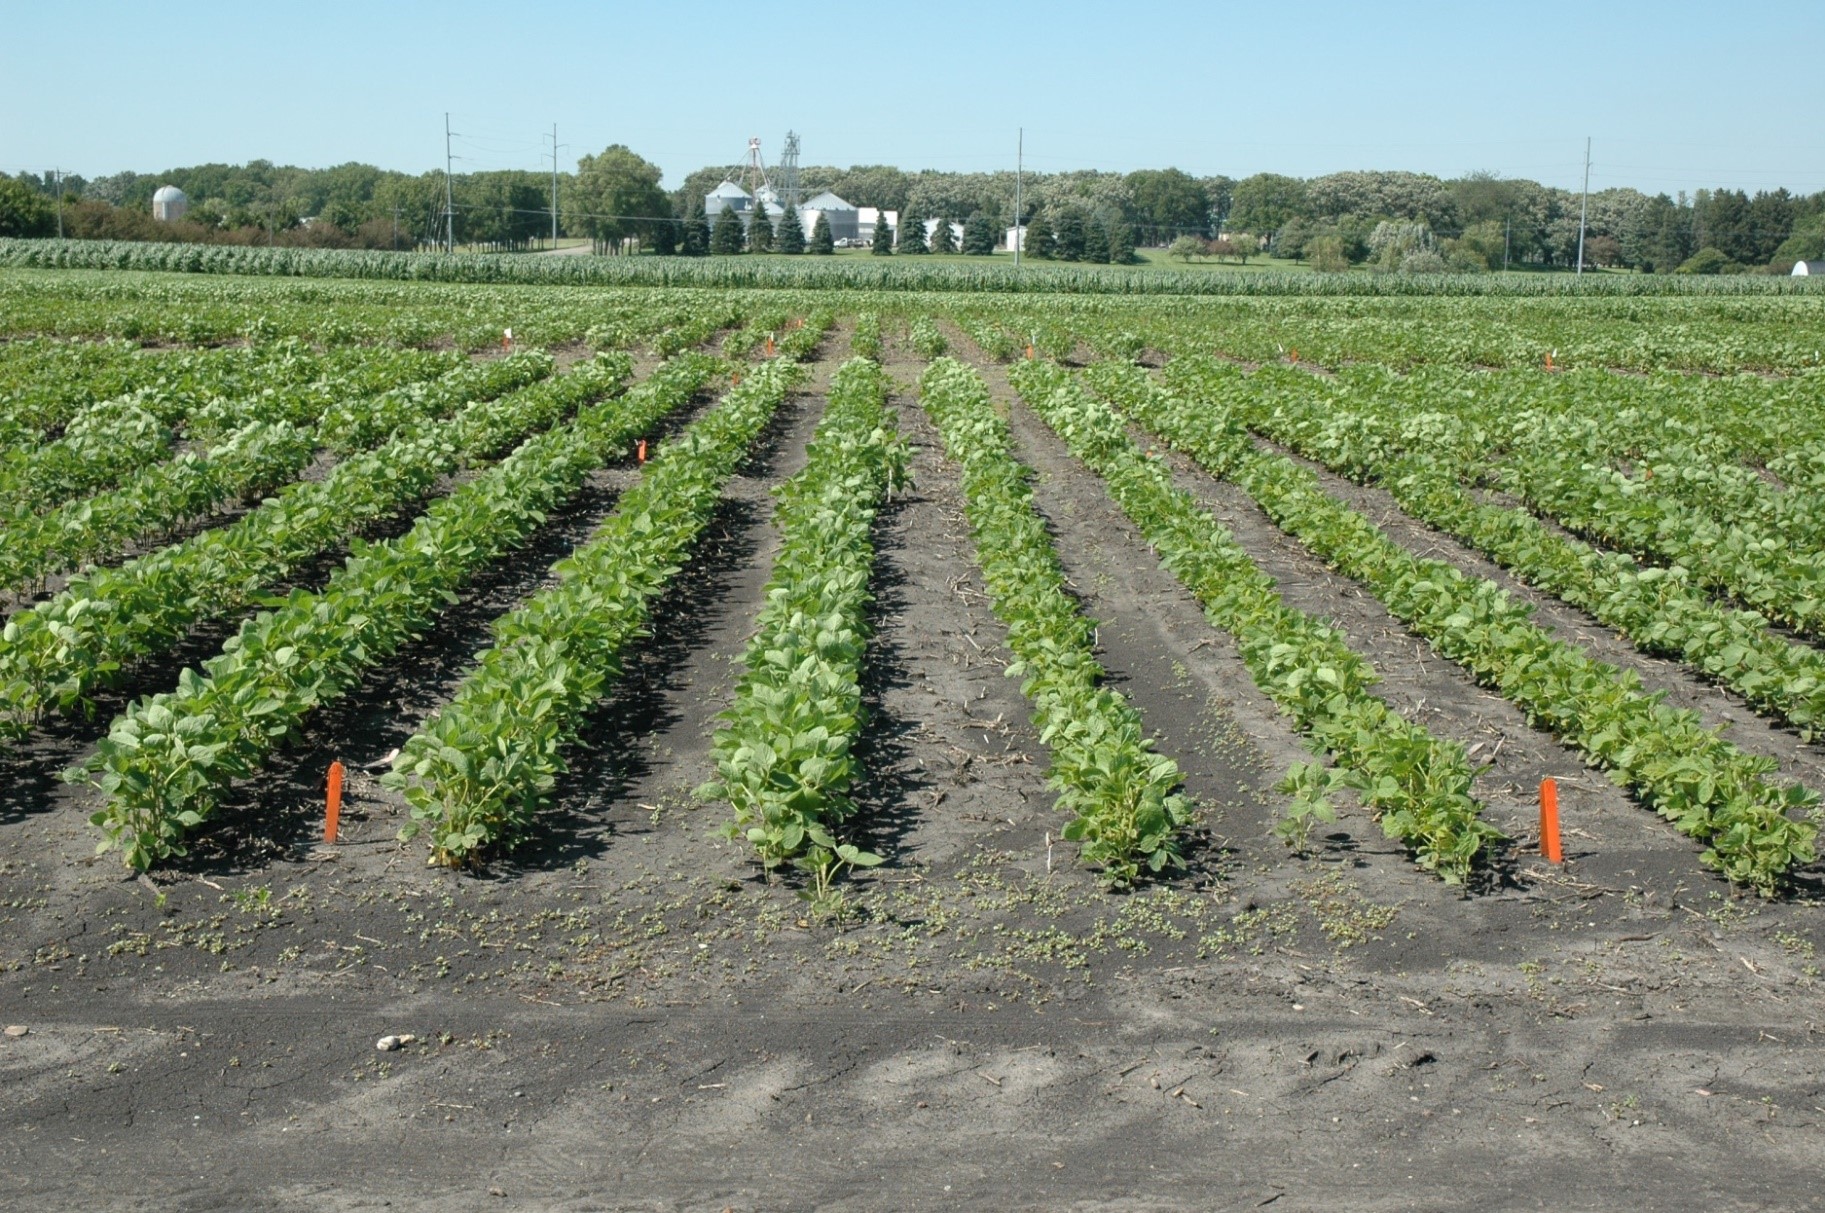
This 12-year experiment was conducted in a field (Figure 1) in Waseca, Minnesota, from 2003-2014. The field site was initially infested with the SCN HG Type 0 (race 3). The experiment included two tillage treatments, each combined with 11 soybean variety sequences. The tillage treatments were no-till (NT) and conventional tillage (CT). The conventional tillage treatment was fall chisel plowed after harvest and field cultivation in the spring followed by a soil finisher prior to planting. Each of the 11 variety sequences (Table 1) consisted of one or more of an SCN-susceptible soybean variety (S) and three varieties carrying resistance from either PI 88788 (R1), Peking (R2), or PI 437654 (R3).
Soybean cyst nematode population density in each subplot was determined at planting and harvest. Virulence phenotypes (HG Types) of the SCN populations were evaluated on the sources of resistance PI 88788, Peking, and PI 437654 with the SCN-susceptible Lee 74 soybean as a control. Briefly, soil samples were collected in the spring of 2007, 2008, 2009, 2010, 2012, and 2014 and the number of SCN females (cysts) formed on each soybean plant was counted in a greenhouse bioassay. A Female Index (FI) of SCN on each plant was determined by comparing SCN female number on the line with the female number on the SCN-susceptible soybean ‘Lee 74’:
- FI = Female number on a given plant x 100 / mean number of females on Lee 74.
| Sequence | 2003 | 2004 | 2005 | 2006 | 2007 | 2008 | 2009 | 2010 | 2011 | 2012 | 2013 | 2014 |
|---|---|---|---|---|---|---|---|---|---|---|---|---|
| 1 | S | S | S | S | S | S | S | S | S | S | S | S |
| 2 | R1 | R1 | R1 | R1 | R1 | R1 | R1 | R1 | R1 | R1 | R1 | R1 |
| 3 | R2 | R2 | R2 | R2 | R2 | R2 | R2 | R2 | R2 | R2 | R2 | R2 |
| 4 | R3 | R3 | R3 | R3 | R3 | R3 | R3 | R3 | R3 | R3 | R3 | R3 |
| 5 | R1 | S | R2 | S | R1 | S | R2 | S | R1 | S | R2 | S |
| 6 | R2 | S | R3 | S | R2 | S | R3 | S | R2 | S | R3 | S |
| 7 | R3 | S | R1 | S | R3 | S | R1 | S | R3 | S | R1 | S |
| 8 | R1 | R3 | S | R1 | R3 | S | R1 | R3 | S | R1 | R3 | S |
| 9 | R2 | R1 | S | R2 | R1 | S | R2 | R1 | S | R2 | R1 | S |
| 10 | R3 | R2 | S | R3 | R2 | S | R3 | R2 | S | R3 | R2 | S |
| 11 | R1 | R2 | S | R3 | R1 | S | R2 | R3 | S | R1 | R2 | S |
S = Pioneer 92B13, susceptible to SCN
R1 = Latham EX547 RR N (PI 88788 resistance)
R2 = Pioneer 91M90 (Peking resistance)
R3 = Latham AR5084 (PI 437654 resistance)
Results
SCN population densities
Overall, egg population densities on susceptible soybean were greater than that on the SCN-resistant soybean varieties especially in earlier years. The initial SCN egg population density at planting in 2003 was 4,579 eggs/100 cm3 of soil. In the fall of 2003, the average egg population densities after one growing season on S (susceptible ‘Pioneer 92B13’), R1 (‘Latham EX547 RR N’ derived from PI 88788), R2 (‘Pioneer 91M90’ derived from Peking), and R3 (‘Latham AR5084’ derived from PI 437654) were 8,485, 2,055, 934, and 1,208 eggs/100 cm3 of soil, respectively, indicating all three varieties (R1, R2, R3) were resistant to the original SCN population in the field. In later years, data indicated that the level of SCN resistance was highest in R3, intermediate in R2, and lowest in R1. Tillage had little effect on SCN egg population density.
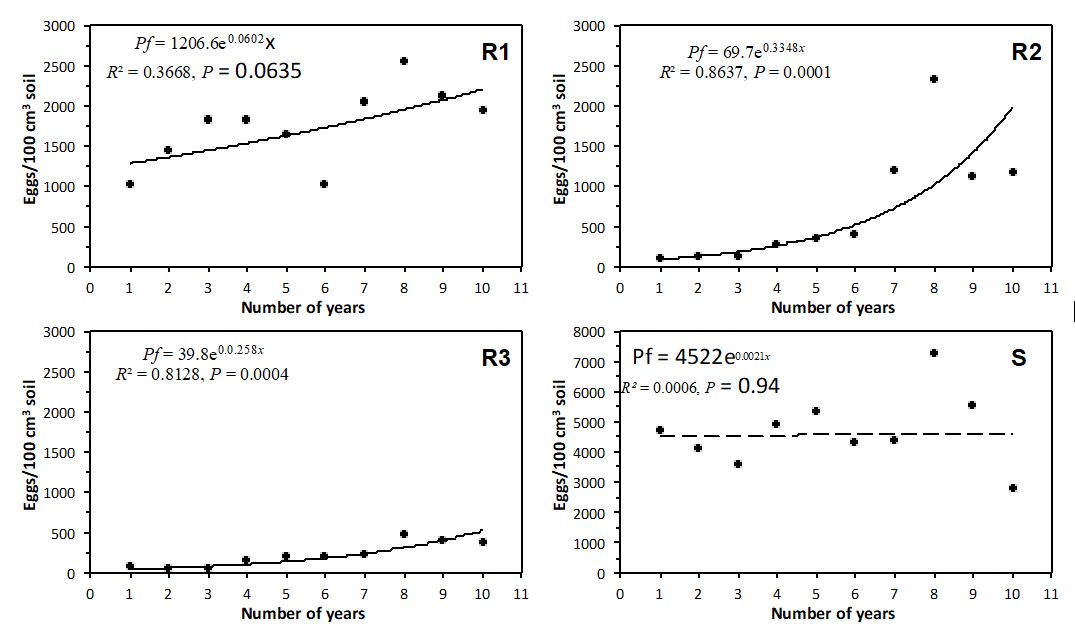
In continuous monoculture of the three resistant varieties, egg population densities increased over years from 2005 to 2014 (Figure 2). In Figure 2, Year 0 was the fall of 2004 when the egg population densities were at their lowest point. R1 is SCN-resistant ‘Latham EX547 RR N’ derived from PI 88788; R2 is SCN-resistant ‘Pioneer 91M90’ derived from Peking; R3 is SCN-resistant ‘Latham AR5084’ derived from PI 437654; S is SCN-susceptible ‘Pioneer 92B13’. Each data point in the graphs is an average of two tillage treatments with six replicates.
The egg population densities in the 2005 fall were estimated at 1206, 70, and 40 eggs/100 cm3 of soil on R1, R2, and R3 monocultures, respectively. After 10 years, the egg population densities in the fall of 2014 were 2203, 1983, and 525 eggs/100 cm3 of soil on R1, R2, and R3 monoculture, respectively. The rate of increase of SCN population densities over years was highest in R2 (1.40/year), followed by R3 (1.29), and lowest in R1 (1.06). No annual increase or decrease of SCN fall egg population density over the 10 years was detected on the SCN-susceptible soybean monoculture (Figure 2).
Virulence of the SCN populations
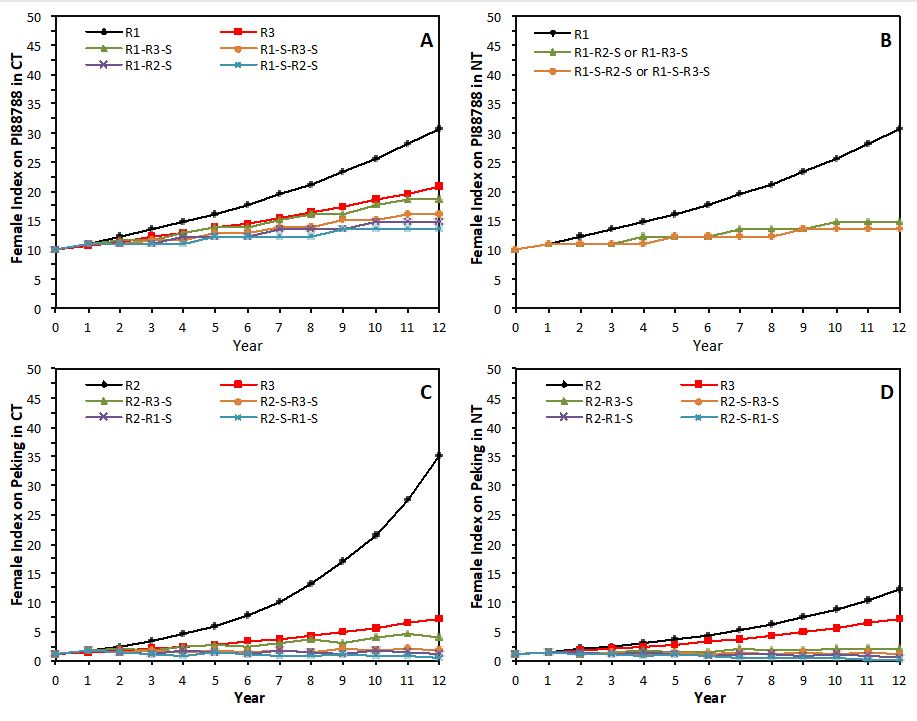
The effects of tillage and soybean varieties on SCN virulence in the different sequences are presented in Figure 3. Significant effects of PI88788-derived R1, and PI437654-derived R3, and tillage were observed on the FI on PI 88788 (Figure 3A,B). However, a significant effect of R3 was detected only in CT (Figure 3C). Both R1 and R3 selected SCN populations towards increased virulence to PI 88788, and R1 had greater effect than R3. The FI of the initial population on PI 88788 was estimated at 10.
Monoculture of R1 had the greatest selection pressure and after 12 years of monoculture the FI on PI 88788 was estimated at 31 (Figure 3A,B). Monoculture of R3 for 12 years selected the SCN population in CT soil that had FI 21 on PI 88788. Rotation of one or two SCN-resistant soybean varieties with susceptible soybean slowed the change of FI on the PI 88788 (Figure 3A,B). No effect of the susceptible soybean and Peking-derived R2 on the FI on PI 88788 was detected.
There was greater effect of the varieties and tillage on the FI of the SCN populations on Peking than PI 88788 (Figure 3C,D). R2 and R3 had positive effect and R1 and S had negative effect on the SCN FI on Peking. The FI of the SCN population at the beginning of the experiment on Peking was estimated to be only 1.18. There was greater effect of R2 on FI on Peking in CT than NT; monoculture of R2 for 12 years increased FI on Peking to 35 in CT soil and 11 in NT soil (Figure 3C,D). Monoculture of R3 increased FI on Peking to 7.3 in both CT and NT. Rotation of one or two SCN-resistant soybean varieties with the susceptible soybean resulted in only a small increase of FI on the Peking over the 12 years (Figure 3C,D).
The FI on PI 437654 were 0 or less than 1 in most measurements, indicating the soybean line had broad resistance, and no nematodes virulent to PI 437654 were selected by any of the varieties and tillage treatments.
S is SCN-susceptible ‘Pioneer 92B13.’
R1 is SCN-resistant ‘Latham EX547 RR N’ derived from PI 88788.
R2 is SCN-resistant ‘Pioneer 91M90’ derived from Peking.
R3 is SCN-resistant ‘Latham AR5084’ derived from PI 437654.
The model for FI on PI 88788 after a variety sequence is: FI = 11e(0.08779R1 + 0.05699T x R3) -1.
The model for FI on Peking is: FI = 2.18e(0.14985R2 + 0.11135R3 + 0.08392T x R2 – 0.08394R1 – 0.14204S) -1.
In the models, R1, R2, R3, and S are number of years of the soybean varieties in a crop sequence; T is tillage where no-till is 0 and conventional tillage is 1.
This long-term research project was supported by Minnesota Soybean Producers check-off funding through the Minnesota Soybean Research and Promotion Council, and the Minnesota Agricultural Experiment Station. The author thanks C. Johnson, W. Gottschalk, H. Neigebauer, M. Getzke, Y. N. Vuong, F. Shi, J. Ballman, students, and many summer temporary workers for technical assistance; and Angie Peltier and Bruce Potter for reviewing the article.
1. Chen, S., Kurle, J., Malvick, D., Potter, B., and Orf, J. 2011. Soybean cyst nematode management guide. University of Minnesota Extension. Web/URL: https://extension.umn.edu/soybean-pest-management/soybean-cyst-nematode-management-guide#spread-in-minnesota-1506960.
2. Niblack, T., and Tylka, G. 2008. Soybean cyst nematode management guide 5th edition. Web/URL: http://www.ncsrp.com/.
3. Chen, S. 2020. Dynamics of population density and virulence phenotype of the soybean cyst nematode as influenced by resistance source sequence and tillage. Plant Disease: doi.org/10.1094/PDIS-09-19-1916-RE.
Reviewed in 2020