With its higher resolution and more accurate zonal information, the new USDA Plant Hardiness Zone Map (PHZM) can be helpful as you plan your garden or landscape.
While the PHZM is a helpful resource, it does not guarantee that your plant will perform well in your landscape based on the hardiness zone alone. A plant's performance is based on other factors like how it was planted, soil type, light, space, wind and overall care.
As a gardener, it's still important to always follow the best practices of plant selection, planting and ongoing care from season to season. A plant's growing requirements should always match the site conditions in your landscape.
Keeping this in mind, here's what to know about the new map and how it was developed.
What's new about the new map?
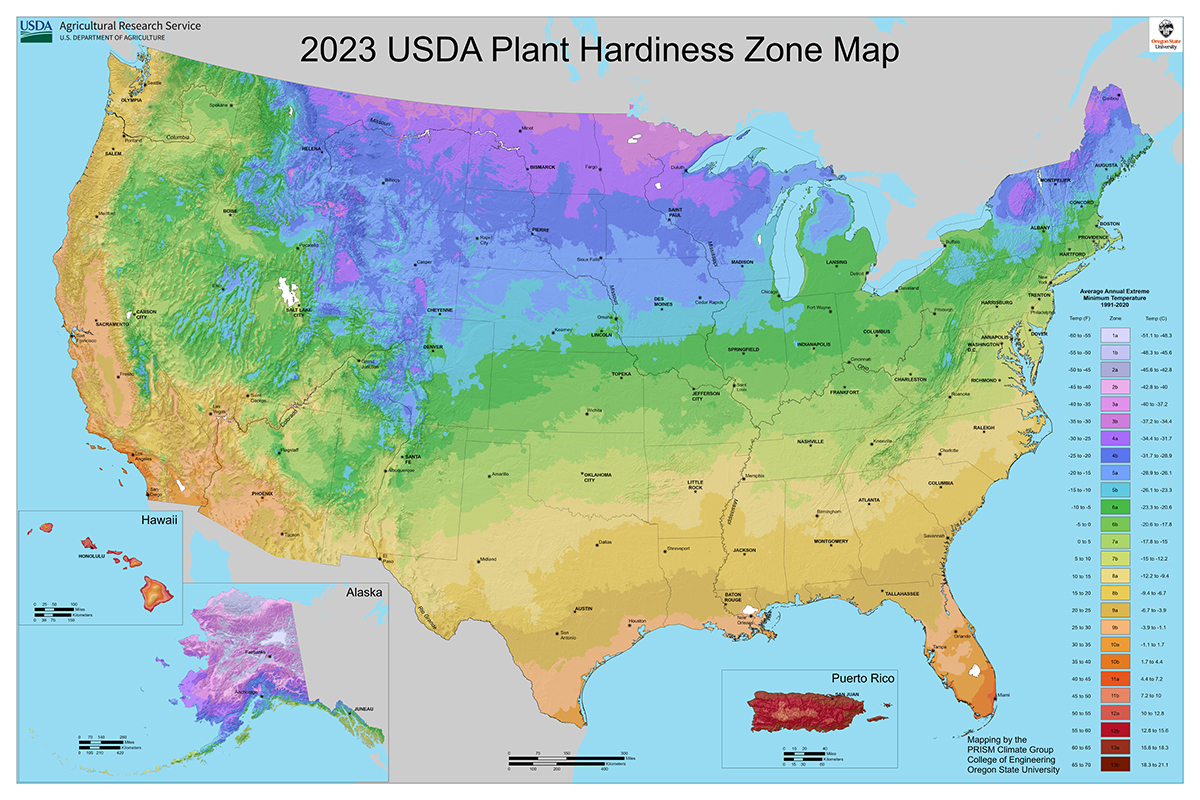
- The new data is based on 1991-2020 GIS data collected from over 13,000 weather stations.
- Zones 12 and 13 were added in Puerto Rico and Hawaii and can help northern gardeners decide when to bring in and put out tropical plants.
- Higher resolution and more accurate zonal delineation, including in and around cities, mountains and bodies of water.
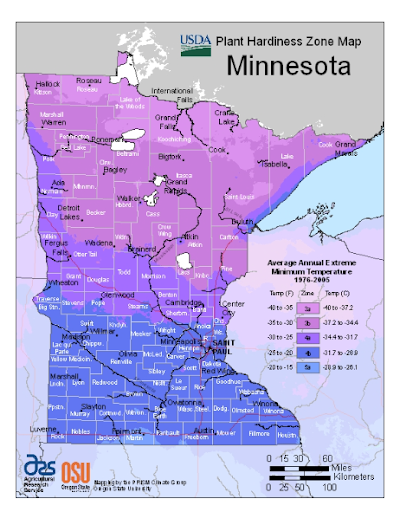
- Minnesota increased its zone 5a area, especially in the south and central parts of the state. However, some areas may report a lower plant hardiness zone number.
- Plant hardiness zones are based on 30-year averages of weather extremes (coldest temperatures). Climate changes are based on overall annual average temperatures over 50-100 years.
New data: 1991-2020
The edition of the USDA PHZM, revised and published in 1990, was drawn from weather data from 1974–1986.
The 30 years of data in the 2012 version and this 2023 version of the USDA PHZM were selected by the group of horticultural, botanical and climatological experts who led the review of the latest revision. This revision balances smoothing out the fluctuations in weather from year to year with the understanding that perennial plants mostly experience what is termed "weather" rather than "climate" during their lifetimes.
The 1991-2020 period also aligns with the period currently in use by climatologists to describe baseline climate "normals" in the U.S.
New zones: 12 and 13

Two new zones were added to the 2012 and 2023 editions of the USDA PHZM.
Zones 12 and 13 have been introduced for regions with average annual extreme minimum temperatures above 50 degrees F and 60 degrees F, respectively. They appear only on the maps for Hawaii and Puerto Rico.
The two new zones will also provide guidance on the cold sensitivity of tropical ornamental plants, helping northern gardeners decide when to bring tropical plants indoors from a deck or patio as the temperature cools.
Finer scale for zonal delineations
Because the 2012 and 2023 maps were created digitally with GIS technology, they have a higher level of resolution and can show smaller areas of zone delineations than earlier maps.
- Cities tend to hold more heat because they encompass large areas of concrete and blacktop, so a city or town might be assigned to a zone warmer than the surrounding countryside.
- Higher elevations tend to be colder than surrounding lower areas, so the top of a mountain might be an area of cooler zones.
- A location near a large body of unfrozen water, especially downwind from the prevailing breeze from that water, might provide milder winter weather and be in a warmer zone.
Climate change and plant hardiness zones
Climate changes are usually based on trends in overall annual average temperatures recorded over 50-100 years.
The USDA PHZM represents 30-year averages of what are essentially extreme weather events (e.g., the coldest temperature of the year); changes in zones are not reliable evidence of whether there has been global warming.
Compared to the 2012 and 1990 maps, zone boundaries in this 2023 edition have shifted in many areas. The new PHZM is generally about one-quarter-zone warmer than reported in the 2012 PHZM throughout much of the United States as a result of a more recent averaging period (1976-2005 vs. 1991-2020).
Some of the changes in the zones are the result of additional data sources and improved interpolation methods. These zone shifts can sometimes result in a cooler rather than warmer zone. The most substantial changes are seen in the upland areas of Alaska.
Details about the making of the map
- A complex algorithm allowed for more accurate interpolation between weather reporting stations, and it accounted for such factors as elevation changes and proximity to bodies of water.
- Temperature station data for this 2023 edition of the USDA PHZM came from many different sources. Minnesota is located in the North Central region, where data was collected primarily from weather stations of the National Weather Service and several state networks.
- Data from 13,625 stations (a substantial increase compared to the 2012 map version) were incorporated into the maps.
- The USDA PHZM was produced with the latest version of PRISM, a highly sophisticated climate mapping technology developed at Oregon State University. Get details about PRISM from the PRISM Climate Group website.
2023 USDA Plant Hardiness Zone Map. https://planthardiness.ars.usda.gov/
Permission is granted to news media to republish our news articles with credit to University of Minnesota Extension. Images also may be republished; please check for specific photographer credits or limited use restrictions in the photo title.