Throughout the alfalfa production season, careful and informed harvest decisions increase the chances of meeting production goals. A stand’s growth from one cut to the next will always vary according to stand health and a range of environmental factors.
Accurately assessing an alfalfa crop in the field is critical for maximizing profitability, in terms of both quality and yield.
In the upper Midwest, where the dairy industry drives forage demands, the crop’s value is especially dependent on forage quality. Higher quality means higher milk per ton, which means greater profitability per ton of forage.
Alfalfa maturity as a quality indicator
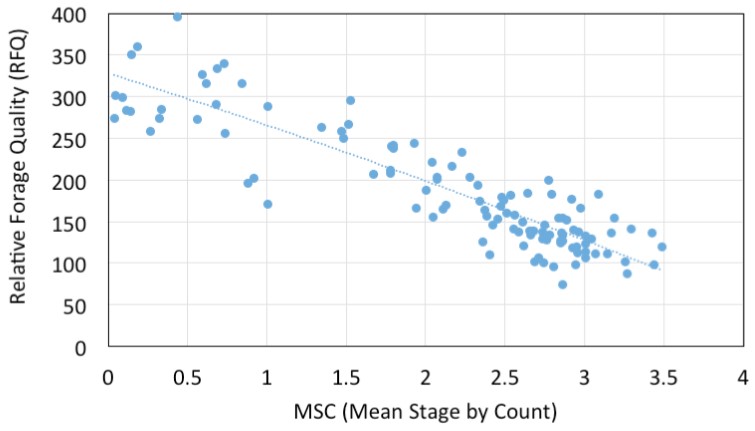
Alfalfa maturity currently is the most accurate and consistent indicator of quality. As maturity increases, forage quality decreases (Figure 1).
Generally speaking, good quality means higher crude protein and lower fiber fractions. Quality is highest when the leaf-stem ratio is highest (more leaves, fewer stems). As alfalfa develops and growth shifts from vegetative to reproductive, quality quickly begins to decrease.
Growth staging alfalfa on the 0 to 9 maturity scale enables the calculation of maturity indices, such as mean stage by count (MSC) and mean stage by weight (MSW). You can interpret the MSC or MSW values as indicators of forage quality parameters.
A sample of alfalfa stems can be individually categorized into the appropriate stages described in Table 1 and illustrated in Figures 2 and 3.
To calculate MSC, count stems in each stage and enter the resulting values into the index equation. To calculate MSW, dry and weigh each maturity group and plug the corresponding values into the equation.
 Vegetative alfalfa, stages 0, 1 and 2; 2) Alfalfa buds, stages 3 and 4; 3) Open flowers, stages 5 and 6; and 4) Alfalfa seed pod, stages 7, 8 and 9.")
 Closed flower, 2) Open flower, and 3) Seed pod.")
Table 1: Alfalfa growth staging guide
| Stage number | Stage name | Stage definition |
|---|---|---|
| 0 | Early vegetative | Stem length is less than 15 centimeters (cm). No buds,flowers or seed pods. |
| 1 | Mid-vegetative | Stem length is 16 to 30 cm. No buds,flowers or seed pods. |
| 2 | Late vegetative | Stem length is greater than 31 cm. No buds,flowers or seed pods. |
| 3 | Early bud | One to two nodes with buds. No flowers or seed pods. |
| 4 | Late bud | Three or more nodes with buds. No flowers or seed pods |
| 5 | Early flower | One node with one open flower (standard open). No seed pods. |
| 6 | Late flower | Two or more nodes with open flowers. No seed pods. |
| 7 | Early seed pod | One to three nodes with green seed pods. |
| 8 | Late seed pod | Four or more nodes with green seed pods. |
| 9 | Ripe seed pod | Nodes with mostly brown,mature seed pods. |
The efficacy of these maturity indices may change as alfalfa is harvested earlier for higher quality and as new, novel varieties of alfalfa are being developed with lower lignin (i.e., higher digestible fiber).
The introduction of these lines will bring new flexibility to alfalfa harvest management and limit the applications of traditional assessment tools. Although alfalfa maturity will still correlate with quality in these new lines, higher quality will be maintained with greater maturity.
This means you can achieve equal quality with higher yields, or higher quality with equal (conventional) yields. Precise and intensive management is critical to optimize these resources and maximize profit margins.
Technology tools to increase profitability
Various new precision agriculture tools and applications are enabling the most efficient use of resources and maximum profitability in other major crops. For example, producers are accounting for in-field variability with variable rate fertilizer application and variable rate planting.
Unmanned aerial vehicles (UAVs) or drones are being equipped with GPS technology and a wide array of sensors/cameras to assess crop health, progress, disease/insect pressure, nutrient deficiencies, etc., and are informing management decisions.
Crop remote sensing
One of most widely used technologies in crop remote sensing is the measurement of canopy reflectance. Broadband spectral indices such as NDVI (Normalized difference vegetative index) are valuable indicators of greenness, crop health or percent ground cover.
More specific indices such as MTCI (MERIS terrestrial chlorophyll index) are designed for more precise applications. Indices designed for specific purposes use the spectral reflectance of particular wavebands (ranges of nanometers in the visible and near-infrared spectrum). The wavebands of importance can vary depending on the crop and target application.
Drones or ground vehicles equipped with these sensors can travel through the field, collecting and mapping data that correlates to the crop’s current status across the whole field.
In 2014, researchers conducted a pilot study to determine whether spectral indices could predict alfalfa maturity.
They used a full-range spectrophotometer, measuring reflectance values 350 to 2500 nanometers (nm), to periodically scan alfalfa plots throughout a stand’s growth, followed by destructive harvest, sampling and analysis for yield, quality and maturity.
Preliminary analysis indicates potential for known spectral indices to predict alfalfa maturity (Figure 4). However, alfalfa-specific indices haven’t yet been developed.
, compared to alfalfa maturity in Rosemount (2014). Measurements taken through the season, before periodic destructive sampling.")
Researchers conducted a follow-up study with similar principles in 2015. Treatments within a replicated experiment were periodically mowed to set up a maturity gradient in the field (Figure 5).
The resulting stand represents a range of maturity, from early vegetative to full flower. Then, multiple forms of remote sensing instrumentation scanned all crops prior to harvest and analysis. LiDAR (Light detection and ranging) technology was added to remotely measure crop height.
Preliminary results indicate potential for this estimated crop height to predict biomass as long as the stand is still erect (prior to lodging), as shown in Figure 6. Researchers aim to develop an alfalfa-specific remote sensing platform as a practical tool for optimizing alfalfa management decision-making.


Reviewed in 2023