What you need to know
The soil test report can be complicated and confusing. This article covers the basics
-
Reporting units
-
Procedures used
-
Relative levels
-
Lime guidelines
For many years, farmers have taken soil samples and sent them off for analysis to finetune their fertilizer management. The results of the laboratory analysis are often confusing. The units used to report the analytical results are not familiar. There are several numbers on the analysis sheet. There is a relationship between the analytical results and fertilizer and lime recommendations. Some explanation of the information which appears on the analytical report would probably be helpful.
The reporting units
The numbers found on any soil test report are the result of some analytical measurement of the nutrients in the soil. Most soil testing laboratories report this measurement as parts per million (ppm) for nutrients other than nitrogen. Some laboratories report measurements in terms of pounds per acre. There is a simple conversion factor for these two reporting systems. That conversion is: ppm x 2 = lb. per acre.
When a lab analyses soil samples for nitrate-nitrogen (NO3--N), they will report the results in two ways. The concentration is reported in ppm. Then, depending on the depth of sampling, the concentration is converted into pounds of NO3--N per acre for each increment of depth that was sampled. For example, if the samples are in depths of 0 to 8 and 8 to 24 inches, the amount of NO3--N at each depth is reported in lb. per acre. The total for the 0 to 24 in. depth is calculated as the total at 0 to 8 and 8 to 24 in. The sample calculations also apply to other depths sampled.
There are a variety of reporting units for soil organic matter content. Some laboratories report the organic matter in relative terms for low, medium, and high. Others report the measured percentage.
The units chosen to report the analytical results do not have any effect on fertilizer guidelines. It is important, however, to be aware of the difference between ppm and lb. per acre when reading the units associated with the numbers on the soil test report.
The procedures used
Analytical procedures used in soil testing are usually standardized. Currently, most soil testing laboratories that operate in the North-Central states use the same analytical procedure when analyzing for a specific nutrient. These laboratories also participate in a quality control program that produces confidence in the analytical results coming from that laboratory.
Relative levels
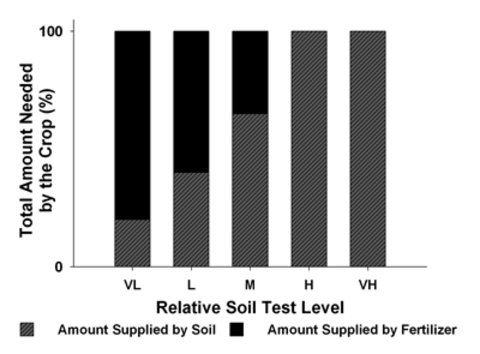
The numbers listed on most soil test reports are usually followed by one of the following letters: VL, L, M, H, or VH. These letters are abbreviations for very low, low, medium, high, and very high, respectively. These letters designate the relative level of the nutrient measured and provide a good indication of the probability of measuring an economic increase in yield if fertilizer supplying the nutrient in question is applied. For example, if the relative level is very low, there is a high probability that crop yields will increase if fertilizer supplying the nutrient in question is applied. By contrast, no increase in yield from the application of the nutrient would be expected if the relative level in the soil is in the very high range. Figure 1 illustrates the relative proportion of nutrient needed from either soil or fertilizer at the various soil test levels.
The relative levels of the various immobile nutrients in soils have been defined in terms of concentration (ppm) measured by the appropriate extraction procedures. These definitions, used by the University of Minnesota, South Dakota State University, and North Dakota State University, are listed in the following table.
| Relative Level | Bray & Mehlich III | Olsen | Potassium | Zinc |
|---|---|---|---|---|
| Very Low (VL) | 0-5 ppm | 0-3 ppm | 0-40 ppm | 0-0.25 ppm |
| Low (L) | 6-11 ppm | 4-7 ppm | 41-80 ppm | 0.26-0.50 ppm |
| Medium (M) | 12-15 ppm | 8-11 ppm | 81-120 ppm | 0.51-0.75 ppm |
| High (H) | 16-20 ppm | 12-15 ppm | 121-160 ppm | 0.76-1.00 ppm |
| Very High (VH) | 21+ ppm | 16+ ppm | 161+ ppm | 1.01+ ppm |
The range of values for each relative level shown in the above table is not used by all soil testing laboratories. A soil testing laboratory can use any range of values that it chooses. A difference in the range of values for each relative level is one source of confusion that adds to the difficulty of evaluating results from more than one soil testing laboratory. The ranges in the preceding table are the end result of a considerable amount of research conducted in the field.
The number associated with any nutrient on a soil test report is an index value associated with one of the five relative levels. It is not the amount of a nutrient that is available for crop use. It is not the total amount of a nutrient present in the soil. The number listed is an index value only and when combined with an expected yield can be used to develop a fertilizer guideline.
Lime guidelines
The soil test report also shows the pH of the soil sample and, if acid, provides a guideline for the amount of necessary liming material. In analysis, the lab will mix the sample with water, stir, then take a pH reading to get the soil pH value. If it is less than 6.0, the lab will mix the soil with a buffer solution and take another reading, known as the buffer pH, which determines the rate of lime to apply.
Reviewed in 2018


