Although magnesium (Mg) is an essential element for plant growth, its use in a fertilizer program receives only minor emphasis in Minnesota. For most of the state, this lack of emphasis is justifiable because when management properly, most soils in Minnesota contain sufficient Mg to meet crop needs. If Mg is limited in the diet, animals can develop grass tetany. Therefore, some special consideration is given to the Mg status of forage crops.
The role of magnesium in the soil
Magnesium is the central core of the chlorophyll molecule in plant tissue. Thus, if Mg is deficient, the shortage of chlorophyll results in poor and stunted plant growth.
Magnesium also helps to activate specific enzyme systems. Enzymes are complex substances that build, modify, or break down compounds as part of a plant's normal metabolism.
Magnesium in the soil
Magnesium is abundant in the earth's crust. It is found in a wide variety of minerals. Magnesium becomes available for plant use as these minerals weather or break down. The majority of the soils in western Minnesota have naturally high levels of Mg. For the acid soils of the eastern counties, the addition of dolomitic limestone in the crop rotation, when needed, should supply adequate Mg for crop growth.
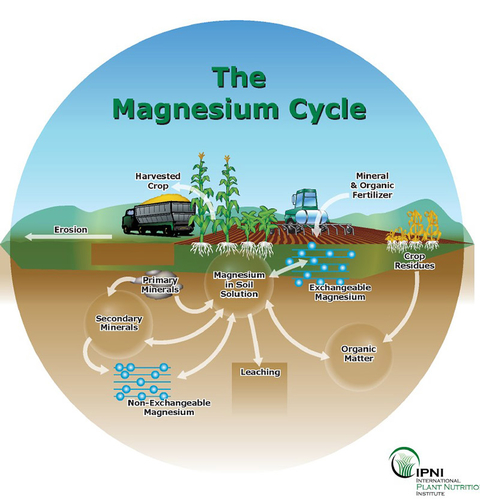
Magnesium is held on the surface of clay and organic matter particles. Although this exchangeable form of Mg is available to plants, this nutrient will not readily leach from soils. The general relationship between forms of Mg in the soil is illustrated in Figure 1.
In Minnesota, Mg deficiency has only been observed on very acid soils. These soils usually have a sandy loam, loamy sand or sand texture. A Mg deficiency is not likely to occur until the soil pH drops below 5.5. In Minnesota, the acid sandy soils occur in the central and east-central part of the state.
The low levels of Mg in soils can occur where potatoes are grown on acid sandy soils or where corn follows a potato crop. Sometimes, grass tetany, a livestock disorder caused by low levels of Mg in the diet, is reported where high rates of potash have been applied to grass pastures. Research trials, however, have shown that the use of Mg in a fertilizer program for these pastures has not increased forage yields. For these situations, it is less expensive to supplement the animal diet with a salt that contains Mg.
Relationship of magnesium to calcium in soils
There are some who believe that there is an "ideal" ratio of calcium to magnesium in soils and one of these two nutrients should be added in a fertilizer program if this "ideal" ratio does not exist. The need for this "ideal" ratio has never been verified by various research efforts throughout the Corn Belt which have focused on the importance of ratios. In Wisconsin, for example, the ratio of calcium to magnesium in soils was adjusted in a range of two to eight by adding different amounts of calcium and magnesium in a fertilizer program. This variation had no significant effect on alfalfa and corn yield. As fertilizer recommendations are developed, emphasis should be placed on providing adequate amounts of magnesium in soils rather than the maintenance of a certain ratio of one nutrient to another.
Deficiency symptoms
Magnesium is a mobile element in the plant and deficiency symptoms will occur first in the oldest leaves.
Corn
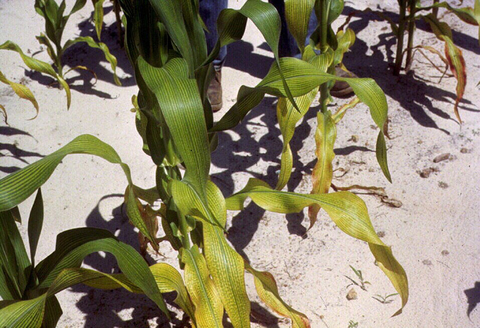
The loss of a healthy green color can be the first indication of a Mg deficiency. Color loss reflects the shortage of chlorophyll in the plant. As the deficiency becomes more severe, the area between the veins of the leaves becomes yellow while the veins stay green. In corn, there is a definite striping the full length of the leaf, appearing first on the lower leaves (see Figure 2).
Potatoes
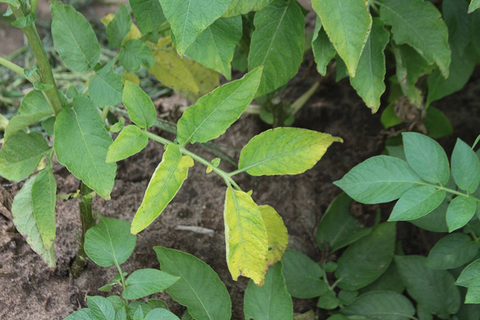
In potatoes, the loss of the green color begins on the tips of the lower leaves when there is a mild Mg deficiency. When the deficiency is more serious, the yellowing progresses between the veins toward the center of the leaf. In the advanced stages of Mg deficiency, leaf areas between the veins show small brown dead spots (see Figure 3). Diseases, herbicide damage, and environmental factors also cause leaves to die prematurely. So, care should be taken in identifying a Mg deficiency. Use plant analysis to be sure.
Predicting the need for magnesium
The critical plant tissue concentrations of Mg in selected crops are listed in Table 1. Since Mg is a mobile element in the plant, the concentration of Mg usually decreases from the top to the bottom of the plant. Also, the Mg concentration usually decreases as the plant approaches maturity. It is, therefore, important to indicate the age of the plant and the part of the plant that was sampled when samples are submitted for a measurement of Mg in plant tissue.
Table 1. Sufficiency levels of magnesium for major agronomic crops, vegetables, and fruits grown in Minnesota.
| Crop | Plant part | Time | Sufficiency range (% Mg) |
|---|---|---|---|
| Alfalfa | Tops (6" new growth) | Prior to flowering | 0.30 - 1.00 |
| Apple | Leaf from middle of current terminal shoot | July 15 - August 15 | 0.25 - 0.45 |
| Blueberry | Young mature leaf | First week of harvest | 0.12 - 0.25 |
| Broccoli | Young mature leaf | Heading | 0.23 - 0.40 |
| Cabbage | Half-grown young wrapper leaf | Heads | 0.40 - 0.75 |
| Carrot | Young mature leaf | Mid-growth | 0.30 - 0.50 |
| Cauliflower | Young mature leaf | Buttoning | 0.27 - 0.50 |
| Corn | Whole tops | Less than 12" tall | 0.25 - 0.65 |
| Leaf at base of ear | Initial silk | 0.20 - 0.65 | |
| Edible bean | Most recently matured trifoliate | Bloom stage | 0.33 - 1.00 |
| Grape | Petiole from young mature leaf | Flowering | 0.30 - 0.40 |
| Pea | Recently mature leaflet | First bloom | 0.30 - 0.70 |
| Potato | Fourth leaf from tip | 40 - 50 days after emergence | 0.30 - 0.55 |
| Petiole from fourth leaf to tip | 40 - 50 days after emergence | 0.30 - 0.55 | |
| Raspberry | Leaf 18" from the tip | First week in August | 0.25 - 0.80 |
| Soybean | Trifoliate leaves | Early flowering | 0.25 - 1.00 |
| Spring wheat | Whole tops | As head emerges from boot | 0.15 - 0.50 |
| Strawberry | Young mature leaf | Mid-August | 0.25 - 0.70 |
| Sweet corn | Ear leaf | Tasseling to silk | 0.20 - 0.50 |
| Sugar beet | Recently matured leaves | 50 - 80 days after planting | 0.25 - 1.00 |
Plant analysis should not be used as the only tool for making fertilizer recommendations. Plant analysis works best when used in combination with soil testing.
The ranges for sufficient concentration of Mg for specified plant tissue in Table 1 have been established for specific stages of growth. When collecting plant samples, every effort should be made to sample the crop at the stage of growth that is listed.
A soil test to measure exchangeable Mg is offered by most soil testing laboratories. In Minnesota, the potential need for Mg in a fertilizer program is highest where sandy soils are very acid. If dolomitic lime has been used in the crop rotation, soils usually have a relatively high level of Mg and it is not necessary to test the soil for this nutrient.
Magnesium recommendations for corn production are summarized in Table 2. The Mg suggestions for fruits and vegetables are listed in Table 3.
Table 2. Magnesium guidelines for corn production.
| Soil test Mg | Relative level | Mg to apply (lb./acre) | Mg to apply (lb./acre) |
|---|---|---|---|
| ppm | Broadcast | Band | |
| 0 - 50 | Low | 50 - 100 | 10 - 20 |
| 51 - 150 | Medium | 0 | Trial* |
| 151+ | High | 0 | 0 |
Table 3. Magnesium recommendations for fruit and vegetable crops.
| Soil test Mg | Relative level | Mg to apply (lb./acre) | Mg to apply (lb./acre) |
|---|---|---|---|
| ppm | Broadcast | Band | |
| 0 - 50 | Low | 100 | 20 |
| 51 - 150 | Medium | 50 | 10 |
| 151+ | High | 0 | 0 |
Sources of magnesium
The application of dolomitic limestone is the most cost effective method for applying the Mg that is needed. The Mg content of dolomitic limestone varies from 8-10%. To be effective, this Mg source should be broadcast and incorporated before planting.
There are fertilizers that are a combination of potassium sulfate and magnesium sulfate. The Mg content is 11 percent. The sulfur (S) concentration is 22 percent and the K2O percentage is 22 percent. This fertilizer is easily used in a starter fertilizer for corn or as a Mg source when there is no desire to increase soil pH.
Irrigation water can contain a substantial amount of Mg2+ which is readily available to a crop. Table 4 summarizes the amount of Mg applied per inch of irrigation water at several locations across Minnesota. The annual application of Mg2+ in irrigation water can exceed the required amounts of this nutrient for crops not sensitive to a deficiency. Any Mg applied with the irrigation water not used by the crop will be detected by a soil test. Use the interpretations in Table 2 and Table 3 to determine if additional fertilizer Mg is required.
Table 4. Magnesium concentration and application rate per inch of water applied for irrigation water sources in Minnesota.
| Location | Year | PPM Mg in water | Lb. Mg applied per inch of water |
|---|---|---|---|
| Becker | 2011 | 6.6 | 1.5 |
| Cannon Falls | 2011 | 9.3 | 2.1 |
| Becker | 2012 | 6 | 1.4 |
| Clear Lake | 2012 | 5.5 | 1.2 |
| Staples | 2013 | 15.6 | 3.5 |
| Becker | 2014 | 21 | 4.7 |
| Becker | 2015 | 18.1 | 4.1 |
| Staples | 2015 | 22.6 | 5.1 |
Summary
Although the need for the addition of Mg to a fertilizer program is not widespread in Minnesota, this nutrient can increase crop production when needed. The potential for need should not be ignored. If there is doubt about the need, analyze the soil to be sure.
Reviewed in 2023


