Quick facts
- Margin compression is when input costs rise faster than the sale price of the product.
- There are strategies you can put in place on your farm to maintain your family’s standard of living.
What is margin compression?
Margin compression is when input costs rise faster than the sale price of the product. As a result, margins decline over time. Margin compression commonly occurs in most industries.
Trends in milk price and production cost
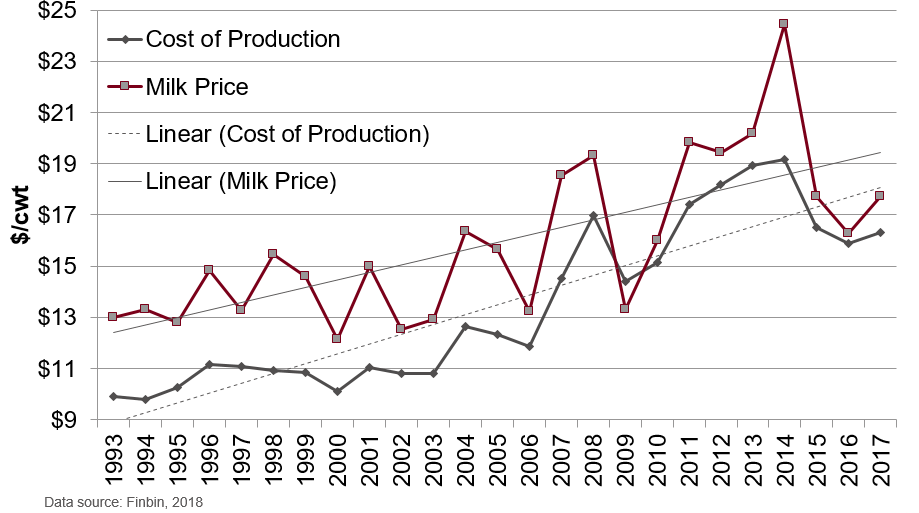
The chart below shows milk prices and production costs for Minnesota dairy farms from 1993 to 2017 with trend lines. Though the ups and downs of milk prices and the cost of production usually maintain a consistent parallel rise over the years. There are points in time (2009 and 2016) when income and output are very close and even cross each other, indicating hard financial times for dairy farmers.
Milk price and production cost changed year to year, but the trend lines became closer over time. Across these 24 years:
-
Production costs increased an average of 28.8 cents per hundredweight (cwt) yearly.
-
Milk prices increased an average of 19.7 cents per cwt yearly.
-
The margin compression was about $2.00 per cwt.
As a result, the margin is about half of what it was in 1993. The margin per cow didn’t drop as much as the margin per cwt within this period. This is because the average milk sold per cow increased 8,100 pounds.
Production costs were quite stable from 1993 to 2003. Costs varied from a low of $9.81 per cwt (1994) to a high of $11.15 per cwt (1996). The average production cost during these 11 years was $10.61 per cwt.
From 2004 to 2006 production costs were higher but quite stable with an average of $12.28 per cwt. But higher corn prices starting in 2007 led the average production cost to increase more than $7.00 per cwt, which peaked in 2014 at $19.48. Production cost decreased since 2014 averaging $16.32 from 2015 to 2017.
Milk prices were less certain than production costs. From 1993 to 2003 milk prices differed by $3.29 per cwt and averaged $13.62 per cwt. But from 2006 to 2017, changes in milk price greatly increased with a range of $11.13 per cwt. The lowest and highest margin years were also during this period with a low margin of -$1.08 per cwt in 2009 and a high of $5.27 per cwt 2014. Milk prices averaged $18.01 per cwt during those 11 years.
Effects of margin compression on producers
Over this time frame, family living costs doubled. Minnesota dairy producers adapted to this margin compression by expanding and improving labor efficiency.
-
The average number of cows on farms in the farm business management program have nearly tripled.
-
The number of pounds of milk sold per full-time worker nearly doubled.
Maintaining your standard of living
Tips for keeping your current standard of living with decreasing margins:
-
Increase the milk per cow and decrease costs fast enough to offset margin compression.
-
This may work if you’re close to retirement but is likely impractical for younger producers.
-
-
Expand your herd to keep up with declining margins.
-
Branch out your operation.
-
Whole farm profitability has been somewhat shielded from increasing feed costs for most Upper Midwest dairy producers. This is because they raise much of their own feed.
-
Long-term milk and feed prices will tend to change together following a lag time. This advantage helps reduce changes in input costs.
-
-
Explore value-added opportunities. Your skills may give you a competitive advantage in some area.
-
These businesses could relate to your core business such as custom chopping or manure hauling. Others may include selling high-value animals or on-farm processing.
-
This may be profitable long term, but usually requires a large upfront investment and a different skill set than cropping or livestock production. Some producers may even be able to expand into other areas such as agritourism.
-
-
Strategically invest in technologies that will increase long-term efficiency and provide your business with a competitive advantage.
Reviewed in 2021


