

Minnesotan’s working in their home county, 2002-2022
To better illustrate the relationship between home and work, the U.S. Census Bureau provides an “OnTheMap” tool. This tool is a web-based mapping and reporting tool that provides detailed information about where people work and where workers live. It’s part of the Longitudinal Employer-Household Dynamics (LEHD) program and integrates data from state unemployment insurance records, federal administrative data, and censuses/surveys.
Key Features of OnTheMap
- Workforce and commuting patterns: It shows how many people commute into or out of a city, county, or region for work.
- Job characteristics: Users can analyze workers by age, earnings, and industry sector.
- Home-to-work flows: It maps where workers live compared to where they are employed.
- Time trends: Data is available by year, typically going back to around 2002. Today, in October, 2025 the most recent data is for 2022 so there is a time lag but this does allow a 20-year examination of these trends.
Traditional uses of OnTheMap data include economic and workforce development studies, understanding commuting patterns (e.g., for transportation planning), identifying labor market areas, and exploring urban/rural employment flows. These data can tell you how many people work there but live elsewhere, where the city’s workers live (e.g., surrounding towns and counties), and which industries dominate employment.
The purpose of this brief is to provide a data-driven report on the relationship between the home and work locations of Minnesota residents using this data source.
Findings
Using data from 2002 and the most recent U.S. Census Bureau release from 2022, data was gathered for each county in the country. Across the United States in 2002, 61% of residents worked in their home county, this has now fallen to 53% in the most recent release of 2022 data. Put another way, 47% of workers left their home county for their job. In Minnesota the pattern is also seen, with 55% working in their home county in 2002, declining to 48% in 2022.
To emphasize this, today more people leave their home county to work, than do not. The 2018 data release marked the crossing of this threshold, where a majority of Minnesota workers followed this pattern, and it continues to grow to this day.
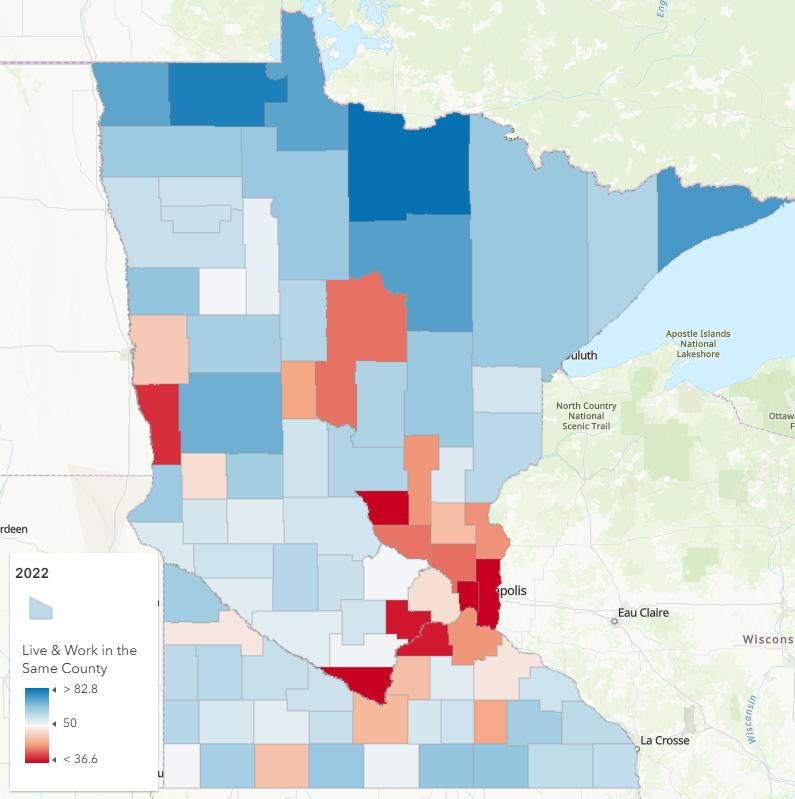
Map: percent working in their home county, 2002 and 2022
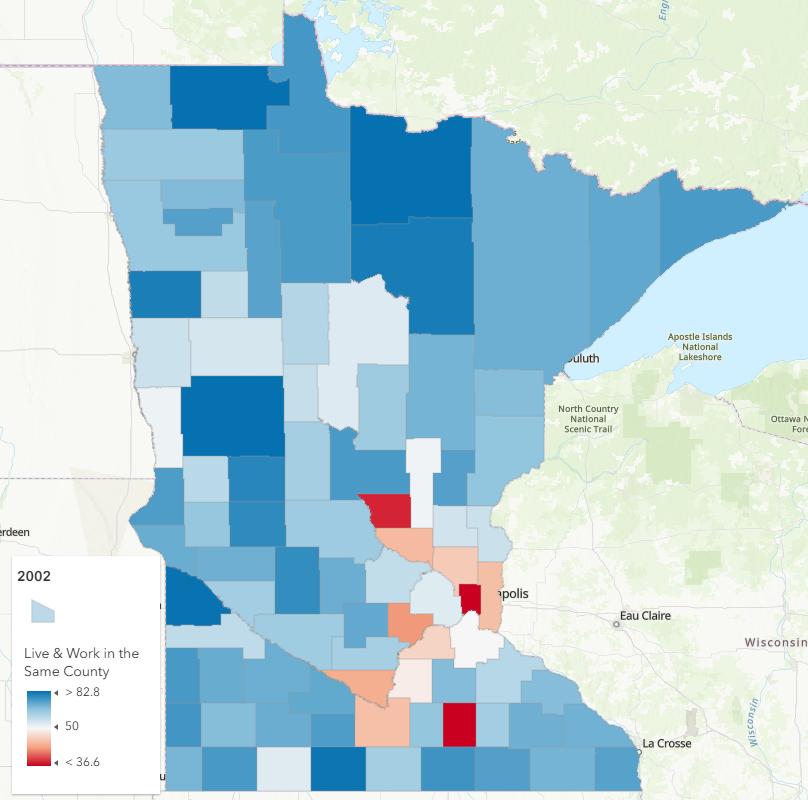
In 2002 just 11 of Minnesota’s 87 counties saw more workers leave their home county every day. These were centered around the Twin Cities and South-Central portions of the state.
Steele county is a good example, it is bordered by the Mankato and Rochester labor markets, and this has had long-standing impacts in the region. The same is true for Sherburne County and its immediate proximity to the city of St. Cloud.
In 2022, the number of counties that witnessed a majority of their residents leaving their home county every day to work rose to 24 (28% of 87) and this group includes more rural communities that have interactions with rural regional centers and metropolitan areas.
Four counties worked against this trend and saw percentage increased in the, essentially, capturing more local residents to work within the county boundaries. Becker (+8%), Cook (+0%), Kittson (+4%), and Steele (+20%) counties increased the percentage of residents staying in their home county to work.
It should be noted that Cook (75%) and Kittson (73%) counties have the highest percentages of residents staying in their home county to work.
See how your county stacks up in the appendix.
Appendix: Percentage of residents working in their home county
| County | % Same, 2002 |
% Same, 2022 |
Change 2002–22 |
|---|---|---|---|
| Aitkin | 70% | 65% | -5% |
| Anoka | 46% | 41% | -5% |
| Becker | 55% | 63% | 8% |
| Beltrami | 75% | 65% | -9% |
| Benton | 38% | 30% | -8% |
| Big Stone | 71% | 55% | -17% |
| Blue Earth | 45% | 45% | -1% |
| Brown | 72% | 57% | -15% |
| Carlton | 68% | 56% | -12% |
| Carver | 43% | 37% | -5% |
| Cass | 54% | 41% | -13% |
| Chippewa | 64% | 54% | -10% |
| Chisago | 57% | 43% | -15% |
| Clay | 57% | 46% | -11% |
| Clearwater | 73% | 52% | -21% |
| Cook | 75% | 75% | 0% |
| Cottonwood | 71% | 53% | -18% |
| Crow Wing | 64% | 62% | -3% |
| Dakota | 50% | 43% | '-7% |
| Dodge | 64% | 44% | -20% |
| Douglas | 79% | 64% | -15% |
| Faribault | 64% | 52% | -12% |
| Fillmore | 70% | 59% | -11% |
| Freeborn | 76% | 66% | -10% |
| Goodhue | 61% | 49% | -12% |
| Grant | 60% | 48% | -12% |
| Hennepin | 54% | 48% | -6% |
| Houston | 73% | 59% | -14% |
| Hubbard | 61% | 61% | 0% |
| Itasca | 81% | 74% | -7% |
| Jackson | 54% | 46% | -8% |
| Kanabec | 74% | 54% | -19% |
| Kandiyohi | 77% | 61% | -17% |
| Kittson | 68% | 73% | 4% |
| Koochiching | 89% | 83% | -7% |
| Lac qui Parle | 82% | 64% | -18% |
| Lake | 72% | 61% | -11% |
| Lake of the Woods | 75% | 73% | -2% |
| Le Sueur | 49% | 45% | -4% |
| Lincoln | 75% | 59% | -16% |
| Lyon | 71% | 60% | -11% |
| McLeod | 72% | 56% | -16% |
| Mahnomen | 59% | 51% | -8% |
| Marshall | 65% | 65% | 0% |
| Martin | 82% | 65% | -17% |
| Meeker | 71% | 57% | -14% |
| Mille Lacs | 51% | 43% | '-9% |
| Morrison | 75% | 61% | -13% |
| Mower | 74% | 66% | -7% |
| Murray | 68% | 55% | -13% |
| Nicollet | 44% | 32% | -12% |
| Nobles | 75% | 63% | -12% |
| Norman | 80% | 66% | -14% |
| Olmsted | 70% | 64% | -7% |
| Otter Tail | 84% | 71% | -13% |
| Pennington | 68% | 57% | -11% |
| Pine | 66% | 60% | -6% |
| Pipestone | 76% | 61% | -15% |
| Polk | 65% | 58% | -7% |
| Pope | 78% | 54% | -24% |
| Ramsey | 37% | 31% | -5% |
| Red Lake | 74% | 57% | -16% |
| Redwood | 71% | 58% | -13% |
| Renville | 64% | 53% | -11% |
| Rice | 68% | 54% | -14% |
| Rock | 69% | 51% | -19% |
| Roseau | 88% | 80% | -8% |
| St. Louis | 71% | 65% | -6% |
| Scott | 47% | 38% | -9% |
| Sherburne | 45% | 41% | -4% |
| Sibley | 63% | 51% | -12% |
| Stearns | 64% | 56% | -9% |
| Steele | 37% | 57% | 20% |
| Stevens | 66% | 56% | -10% |
| Swift | 71% | 57% | -14% |
| Todd | 63% | 56% | -7% |
| Traverse | 74% | 64% | -10% |
| Wabasha | 68% | 57% | -11% |
| Wadena | 58% | 44% | -15% |
| Waseca | 66% | 56% | -11% |
| Washington | 45% | 36% | -10% |
| Watonwan | 74% | 58% | -17% |
| Wilkin | 52% | 38% | -13% |
| Winona | 70% | 59% | -11% |
| Wright | 59% | 51% | -8% |
| Yellow Medicine | 59% | 49% | -10% |
| Region | % Same, 2002 |
% Same, 2022 |
Change 2002–22 |
|---|---|---|---|
| State of Minnesota | 55% | 48% | -7% |
Reviewed in 2026