The growing use of artificial subsurface or tile drainage in Minnesota has sparked much debate about its impact on local hydrology and water quantity and quality. On this webpage, we:
Explain how subsurface drainage affects soil water and the water balance.
Describe how water balance relates to the crop-soil system and drainage.
Address several commonly asked questions about drainage, soil water and hydrology.
Understanding drainage
Agricultural drainage is using surface ditches, subsurface permeable pipes or both to remove standing or excess water from poorly drained lands.
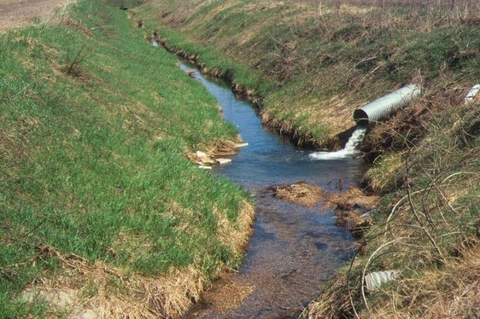
During the late 1800s, European settlers in the Upper Midwest began making drainage ditches and channelizing (straightening and reshaping) streams to carry water from the wet areas of their farms to nearby streams and rivers. Farmers later increased drainage by installing subsurface drainage pipes, generally at a depth of 3 to 6 feet.
Artificial subsurface drainage continues to be a common practice in Minnesota, as well as in other states and countries around the world.
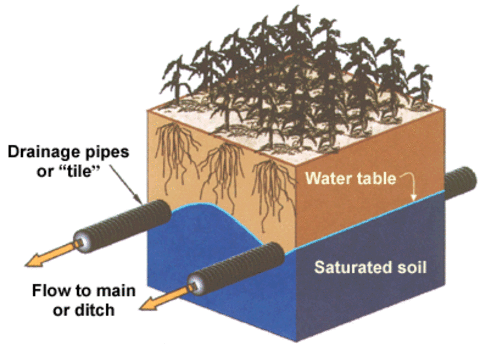
Subsurface drainage is the practice of placing perforated pipe at a specified grade (slope) at some depth below the soil surface. Excess water from the crop root zone can enter the pipe through the perforations and flow away from the field to a ditch or other outlet.
Until the 1970s, most subsurface drainage pipes were made from short, cylindrical sections of concrete or clay called tile. That’s why terms like tile, tile drainage and tiling are still used, even though most drainage pipe today is perforated polyethylene tubing.
How pipes are placed
When installing a subsurface drainage system, either strategically place pipes in a field to remove water from isolated wet areas or install it in a pattern to drain an entire field. In some areas, surface inlets or intakes (riser extended from underground pipes to the surface) remove excess surface water from low spots in the field.
Benefits
Subsurface drainage improves the productivity of poorly drained soils by:
-
Lowering the water table (Figure 1).
-
Providing greater soil aeration.
-
Enabling faster soil drying and warming in the spring.
This may allow producers to plant fields earlier, and for other field operations to take place in a timely fashion.
It also provides a better environment for crop emergence and early growth, and can reduce soil compaction. Once a crop has been established, subsurface drainage greatly reduces the risk of crop water stress from ill-timed or excessive rainfall.
For these reasons, subsurface-drained soils represent some of the world’s most productive soils.
Soils that need drainage
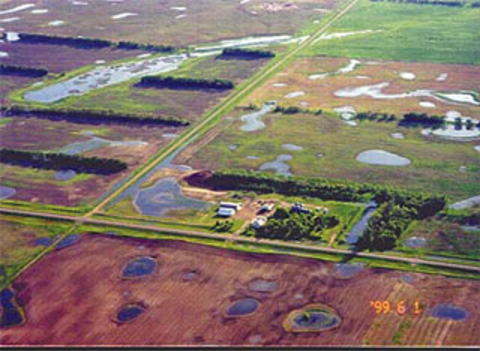
Many soils around the world—including in the Upper Midwest—have poor natural internal drainage (Figure 2). Without artificial drainage, they’d remain waterlogged for several days after excess rain.
This prolonged wetness prevents timely fieldwork and stresses growing crops because saturated soils don’t provide sufficient aeration for crop root development. The roots of most crops grown in Minnesota can’t tolerate excessively wet conditions for more than a couple days.
Soil conditions that make drainage a necessity for some agricultural lands include those with:
-
Slow water permeability or dense soil layers that restrict water movement.
-
Flat or depressional topography.
-
High salt levels at the soil surface (in some areas).
Large areas of Minnesota wouldn’t reliably produce crops if artificial drainage systems hadn’t been installed.
Why farmers invest in drainage
Farmers must make a significant financial investment when installing an agricultural drainage system. They’re willing to make this investment for two major reasons:
-
Agricultural drainage systems usually increase crop yields on poorly drained soils by providing a better environment for plants to grow, especially in wet years.
-
The systems generally help improve field conditions for timely tillage, planting and harvesting.
These two factors have improved agricultural production on nearly one-fifth of U.S. soils.
Drainage installations in Minnesota
The most recent Department of Agriculture comprehensive survey of drained lands showed that in 1985, 30 percent of all agricultural lands in the Upper Midwest (Illinois, Indiana, Iowa, Michigan, Minnesota, Missouri, Ohio and Wisconsin) were artificially drained.
Minnesota has large areas of poorly drained soils—for example, 66 and 59 percent of the soils in the Red River and Minnesota River basins, respectively. In recent years, Minnesota farmers have annually installed as much as 100 million feet of subsurface drainage pipe.
A significant portion of new drainage activities is replacing and enhancing old drainage systems. As old systems age and decay, replacement activities will likely continue.
Key concepts: How drainage influences the soil’s water balance
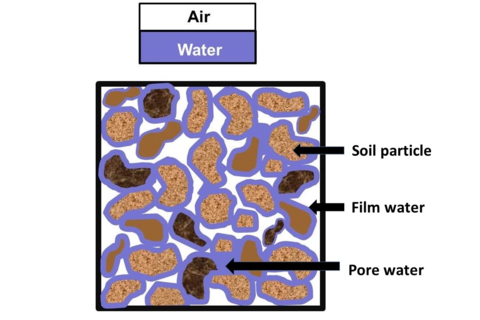
To understand how drainage influences the water balance in the soil, we need to look at the forms of soil water. The soil bulk volume consists of both solids and pore space, as shown in Figure 4.
The proportion of the soil volume that’s pore space depends on soil texture and structure, but typically varies between 35 and 55 percent. Weaker capillary forces hold water in the soil pores, while stronger adsorptive forces hold water as film that surrounds soil particles.
Moisture content: Field capacity and wilting
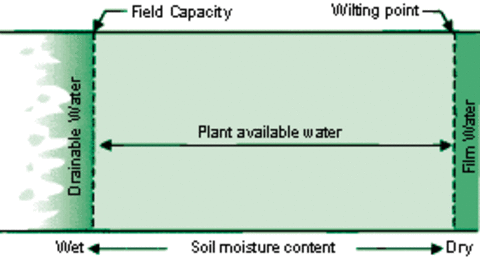
When a soil is sufficiently wet, its capillary forces can hold no more water and the soil is at field capacity. The actual soil moisture content at field capacity varies with soil texture, typically ranging from 15 to 45 percent by volume. Plants can easily extract water from a soil when its moisture is at or near field capacity.
However, as a soil begins to dry out, increasingly stronger forces hold the pore water until plants can no longer extract any water from the soil. This state of soil moisture is the wilting point of a soil.
Soil moisture content at wilting point typically ranges from 5 to 25 percent by volume. Water in the soil between field capacity and wilting point is the plant-available water, and is illustrated in Figure 5.
Expressing water quantities
Throughout this webpage and in common practice, water quantities are expressed in units of depth inches or centimeters, as opposed to units of volume. For example, “a soil holds 3 inches of plant available-water,” or “one inch of water was drained from the soil.”
Expressing soil water this way assumes that its depth applies to a unit area (i.e., a square foot or an acre) or some other area of interest. You can easily compute the volume of water resulting from this depth by multiplying the depth of soil water by the area of interest, making sure to keep the units consistent.
For example, 100 acres of soil that holds 3 inches of plant-available water is: 100 acres x 3 inches = 300 acre-inches (1,089,000 cubic feet or 8,145,000 gallons) of plant-available water.
The changing nature of soil moisture
While the agronomic terms “field capacity” and “wilting point” describe convenient agronomic reference points, soil moisture in the field is constantly changing with time and varies throughout the soil profile (the soil between the ground surface and a particular depth).
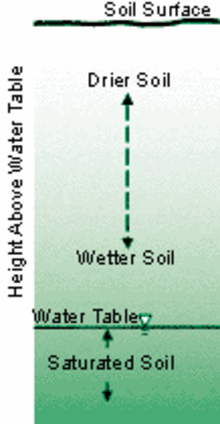
If one could take a snapshot of soil moisture content after a rain, just as the water has stopped moving downward, it might look something like Figure 6. At some depth, the soil is saturated and a water table may be present.
How the water table and its location affects drainage
Soil closer to the water table is wetter than soil closer to the ground surface. This means that as you move up from the water table, the soil pores contain proportionately less water.
If and where a water table forms partially depends on how well the soil drains. A water table may form very near the soil surface in poorly drained soils, while soils that drain well usually don’t have shallow water tables.
Proportions of air-filled and water-filled pores
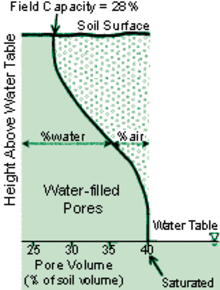
The curved line in Figure 8 illustrates the change in proportion of air-filled and water-filled pores between the water table and the ground surface. If the water table is far enough below the ground surface, at some point above the water table the soil moisture will have drained to field capacity (shown as 28 percent, for example, in Figure 7).
In the absence of additional rain, evapotranspiration (soil evaporation plus plant transpiration) will begin to dry out the soil, further increasing the proportion of empty or air-filled pores.
Poorly drained soils may have water tables at or very near the soil surface for extended periods of time. Under these conditions, the proportion of air-filled pores in the soil profile is very small, so the soil lacks proper aeration to support plant growth.
Subsurface drainage provides a pathway for excess or drainable water to leave the soil. The weakest forces hold the drainable water at moisture contents between field capacity and complete saturation of the soil, as shown on the left side of Figure 5.
Analogy: A potted plant
A common household example may help illustrate this concept. Suppose you water a potted plant that has no holes in the bottom of the pot for water to escape. As you add water, the pot fills until water spills over the top.
At this point the soil is saturated, with little or no air in the soil pores. If you then make a hole in the bottom of the pot, the “drainable” water would drain out and the soil would be left at field capacity. The soil in the pot is now artificially drained, yet no plant-available water (according to our previous definition) has been removed.
When subsurface drainage is present, excess water drains—by the same process as the example above—from the soil profile through the drains, until the water table is lowered to the drain’s depth, below the ground surface.
How much water can drain from the soil
A first step toward understanding the hydrology of drainage is understanding how much water can drain from the soil profile by subsurface drainage. The amount of drainable water in the soil depends on the soil’s amount of drainable pore space or drainable porosity (Pd).
Expressing drainable porosity
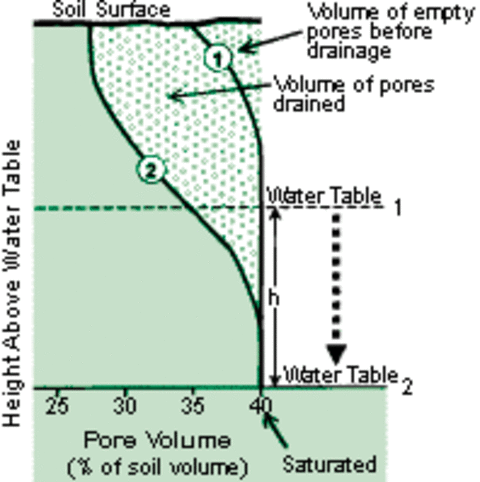
One way to express drainable porosity is the quantity of water drained for a given drop in the water table, which is the height (“h” in Figure 8) and described by the following relationship:
Pd(%) = (drainable pore water in inches x 100) / (h in inches)
or, drainable water = Pd x h / 100
Figure 8 shows that drainage causes the water table to drop the distance “h” from its initial position at one to its final position at two. The curves marked one and two are precisely the same curves as described in Figure 7, showing the proportions of air- and water-filled pores above the initial and final water tables, respectively. The area between the curves illustrates the volume of pores that have been drained.
Another way to think of drainable porosity is the percentage of air-filled pores present when the soil has drained to field capacity. This is calculated as soil porosity minus soil moisture content at field capacity.
How soil influences drainable porosity
Soil texture and structure influences drainable porosity, as shown in Table 1.
Sands or more coarsely textured soils have large drainable porosities, while clays or fine-textured soils have smaller drainable porosities. This means that for an equal amount of water drained, a sandier soil will show a smaller water table drop than a soil with higher clay content.
Table 1: Field capacity, wilting point and drainable porosity by soil texture
| Soil texture | Field capacity (percent by volume) | Wilting point (percent by volume) | Drainable porosity (percent by volume) |
|---|---|---|---|
| Clays, clay loams, silty clays | 30-50% | 15-24% | 3-11% |
| Well-structured loams | 20-30% | 8-17% | 10-15% |
| Sandy | 10-30% | 3-10% | 18-35% |
A Pd of 10 percent, for example, means that draining one inch of water lowers the water table 10 inches. Stated another way, lowering the water table 10 inches means an inch of water has been drained from the soil profile.
Example
As an example, consider a soil with an average drainable porosity of 8 percent, with a high water table at 6 inches below the soil surface. To lower the water table to a depth of 48 inches below the soil surface, 3.36 inches of water must be drained from the soil profile (42-inch water table drop times 8 percent divided by 100 = 3.36).
Water balance, when applied to a crop-soil system, describes the fate of precipitation and the various components of water flow in and around the soil profile. Because drainage affects soil water, other components of the water balance are also affected.
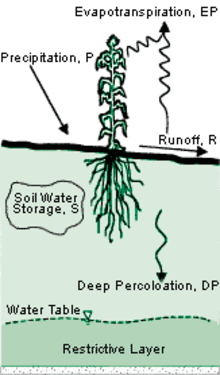
By understanding soil water and drainable porosity, we can now consider these effects. First consider a simple water balance on a soil profile with good natural drainage, as pictured in Figure 9.
How precipitation affects the water balance
In the typical case, precipitation (P)—rainfall, snowmelt, irrigation (if practiced)—is the major water input to the crop-soil system, affecting:
-
Surface runoff water (R).
-
Crop evapotranspiration (ET).
-
Deep percolation (DP).
-
Changes in soil water storage (S).
In Figure 9, we assume no water enters the soil from adjacent areas by horizontal flow (an assumption that’s not true in some cases). Mathematically, the water balance equation can be written as:
P = R + ET + DP + S
When the water table is relatively deep, as shown in Figure 10 (3 to 15 feet), deep percolation recharges it. If deep percolation continues, there’s an opportunity for the water table to rise. The water balance demonstrates that the amount of deep percolation depends on the extent to which R, ET and S reduce the precipitation input to the soil.
Impact of drainage
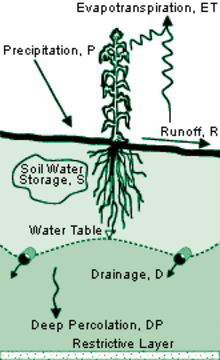
The same water balance relationship holds true in an artificially drained soil profile, as depicted in Figure 11. However, now drainage flow (D) becomes a major component of the water leaving the system.
As before, the amount of drainage depends on how much precipitation is lost to R, ET and S. Simply put, the quantity of drainage flow is driven by precipitation and the relative proportion of the other components of the water balance.
This means the impact of drainage will vary on an annual basis and from region to region. This is certainly true in Minnesota, which has a 13- to 15-inch variation in annual rainfall across the state. The water balance equation can now be written as:
P = R + ET + DP + S + D
A comparison: Poorly drained soil vs. draining
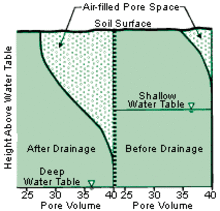
Let’s compare the water balance of a poorly drained soil with a high water table to the same soil after it’s drained, without considering the influence of a growing crop. Figure 11 shows the distribution of water- and air-filled pores above a shallow water table in the poorly drained soil (right portion), and above a deep water table in the same soil profile after drainage has occurred (left portion).
After draining, the soil has more pore volume available for water infiltration during the next rain because of the larger volume of empty pores.
Consequently, more infiltration and less runoff may occur with an artificially drained soil compared to a poorly drained soil, depending on the next rain’s nature and timing. A very intense rain may not produce much infiltration in either case.
Factors affecting infiltration
How much more infiltration could occur on the drained versus the undrained soil? This depends on many factors, but the amount will be greater when:
-
The difference between the shallow and deep water table levels is greater (i.e., very high initial water table drained to a greater depth).
-
The poorly drained water table is closer to the soil surface.
-
Soil textures are coarser.
A water balance example
Consider two soils, each with a drainable porosity of 3 percent. The undrained soil has a water table 6 inches below the surface, and the drained soil has a water table at 48 inches, the depth of the drain.
The undrained soil has 0.18 inches (6 inches times 3 percent divided by 100) of available pore space between the water table and the surface, while the drained soil has 1.44 inches (48 times 3 percent divided by 100). The drained soil has 1.26 inches (1.44 minus 0.18) more available (empty) pore space than the undrained soil.
Runoff
If a low-intensity, 1.5-inch rain occurred, our simple water balance would lead us to expect 0.06 inch of runoff from the drained soil (the soil can hold 1.44 inches) and 1.32 inches of surface runoff from the undrained soil (the soil can hold 0.18 inch). Following the rain, both soils are saturated to the soil surface.
Additionally, we would expect 1.44 inches of drainage from the drained soil over the following 24 to 48 hours to bring the water table back to the 48-inch depth.
With this simple example, we estimate that we lose about 1.32 inches of water as surface runoff from the undrained soil, compared to 1.44 inches of water over the next 24 to 48 hours as drainage from the drained soil.
Water loss timing
The real difference between the two, in terms of water loss, is timing.
The 1.32 inches of surface runoff from the undrained soil will occur relatively rapidly (perhaps in a few hours) compared to the 1.44 inches of water outflow from the drained soil. Water from the drained soil must first pass through the soil before it reaches the drainage system.
Thus, the resultant flow at the drainage outlet will typically occur over a longer period of time, and with a lower peak flow, than surface runoff from the undrained soil. Consequently, for drained soil, the total runoff rate (surface runoff + drainage flow) is typically reduced.
Rain depth and intensity
For a given soil, the magnitude of this reduction depends on the rain’s depth and intensity. Smaller rains of low intensity will more dramatically reduce the total runoff rate because proportionally more water will have an opportunity to infiltrate and pass through the drainage system.
In addition, smaller rains may cause surface runoff on the undrained soil and no surface runoff at all on the drained soil. However, if one or more rains occur before the drained soil has had time to adequately drain, it will diminish the water balance differences between the two soils.
Effect of drainage
Based on this analysis—without the influence of a growing crop—we see drainage can, to some degree, enhance the soil profile’s ability to store water and alter runoff rates and volumes. Some know this as the sponge effect of subsurface drainage.
Bear in mind these simple calculations are only volume balances and don’t take into account the dynamic nature of rainfall and other factors associated with the rainfall-runoff process. Nevertheless, the calculations are useful in understanding the potential influence of drainage on the water balance of a soil and how this may affect hydrology.
Finally, we must consider the influence of a growing crop on the water balance. We previously included crop evapotranspiration (ET) in the water balance, but haven’t yet explored the changes in the soil profile that take place over the growing season in response to drainage.
How drainage affects crops
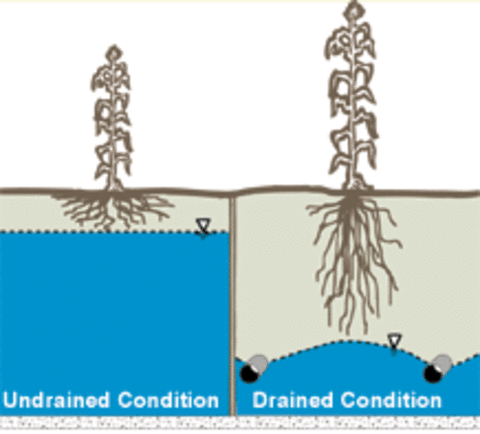
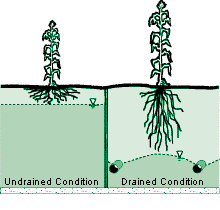
A shallow water table characterizes the undrained condition, shown in Figure 12. This condition almost always exists in poorly drained soils in the spring, and may extend into or recur later in the growing season, depending on seasonal precipitation patterns.
Due to saturated conditions near the soil surface, the depth of crop root development may be severely restricted, even effectively eliminated (in the most poorly drained soils). In such conditions, the effective root zone depth will be a fraction of what it could potentially be in a well-drained or artificially drained soil.
The deep root structure in the drained condition section of Figure 12 plays an important role in the water balance and the crop’s health and production.
Drainage may even be advantageous in unseasonably dry years. And when dry summer conditions follow a wet spring, the crop may have an increased resistance to drought because plant roots can access water in deeper—and more moist—soil.
The sponge effect
The presence of a vigorously growing crop increases the sponge effect in a drained soil.
As the growing season progresses and crop ET increases, crop water uptake will further dry the root zone, causing an upward flow of water from below. By drying out the soil in and below the root zone, the crop creates yet more empty (air-filled) pore space compared to drained soil with no crop.
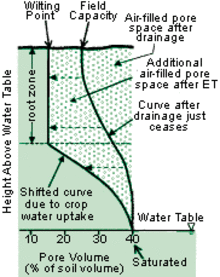
This drying effect can be illustrated by the change in the soil air to water percentage curve shown in Figure 13 (the curve shifts to the left).
The shaded area between the curves represents the additional empty pore space created by crop-induced drying of the root zone and water’s upward flow to that zone. The deeper and healthier the root system, the larger this effect will be for a given crop, with the maximum effect occurring later in the growing season as the crop and its root system matures.
The shifted curve in Figure 13 represents the extreme case where the soil moisture in the root zone has been depleted to the wilting point.
An illustration with field data
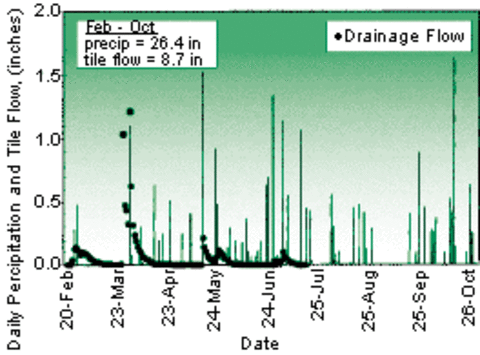
The graph in Figure 14 illustrates how water balance dynamics can change over the growing season due to subsurface drainage and crop growth. The figure shows the daily subsurface drainage flow and precipitation over the 1998 growing season for corn on a Webster clay loam soil.
Precipitation for the season was 36.4 inches. Of this, 26.4 inches occurred between Feb. 22 and Nov. 1 (the period shown in Figure 14).
Drainage flow throughout the growing season
The highest drainage flow corresponds to the period just following soil thaw, in late March and early April. From this point on, the peak subsurface flows decreased throughout the growing season.
After mid-July, no more subsurface flow occurred, despite rains as large or larger than those that occurred earlier in the season (note the rains of nearly 1 inch and 1.7 inches in September and October).
Why there was no subsurface flow later in the growing season
Without surface runoff data, there are two possible explanations for the absence of subsurface flow later in the growing season. Either:
-
All the late-season rains were of very high intensity, generating mostly surface runoff and little infiltration.
-
The combination of subsurface drainage and crop growth produced a drier soil profile and more available pore space for absorbing the rainfall.
While it’s likely that some of the late-season rains were of high intensity, it’s equally likely that many weren’t. What’s not evident from the above data are the proportions of the drainage and crop effects, relative to one another.
However, these data illustrate that subsurface drainage and crop growth together create a buffering capacity or sponge effect as the growing season progresses. It’s hoped that results from current drainage research in Minnesota will strengthen our understanding of drainage and the water balance for this region.
Understanding the above concepts is helpful in addressing broad issues and policy questions related to drainage and water management. Discussions typically focus on the following questions that have important policy implications for local and state decision-makers:
-
Does subsurface drainage lessen or worsen localized flooding?
-
Are catastrophic floods more frequent because of subsurface drainage?
-
Does subsurface drainage alter the quantity of flow in a river basin?
-
Do subsurface-drained soils respond more like a sponge to excess rainfall, compared to poorly drained soils?
-
How do surface inlets (intakes) affect the quantity and quality of drainage flow?
-
How do artificially drained lands impact water quality?
How does subsurface drainage promote better plant growth on poorly drained soils?
Subsurface or tile drainage removes excess water from the soil water that prevents air and oxygen from getting to plant roots. Without artificial drainage, plants have difficulty establishing a healthy root system on poorly drained soils.
Subsurface drainage provides the mechanism for these soils to drain to field capacity in a reasonably short time period so plant growth isn’t significantly impaired. In addition, drainage often permits spring field operations (e.g., tillage, planting) to take place in a more efficient and timely way.
Depending on seasonal rainfall, this can have the effect of adding days, to a week or more, to the length of the growing season, providing another source of potential crop yield improvement.
Does subsurface drainage remove plant-available water from the soil?
No, drainage doesn’t increase or decrease plant-available water in the soil profile. Drainage removes drainable water from the soil the same way a potted plant with a hole in the bottom of the pot drains after watering.
However, upward flow can occur in soil with tile drains, from the water table to the root zone, providing an important source of moisture for crop growth. On lighter (coarser) soils, placing drains too deep can limit this source of moisture.
Is groundwater or rainfall the source of subsurface drainage water?
In most situations, flow from drainage systems is shallow groundwater that’s replenished by rainfall. The less rainfall there is, the less drainage flow there can be. However, in some cases drainage systems are designed to intercept lateral flow.
Does subsurface drainage cause more water to leave the field compared to undrained conditions?
While not true for all cases and locations, in general, subsurface drainage may cause 10 to 15 percent more water to leave the field than agricultural land with surface drainage only. This number is based on drainage simulation models, as variations this small are difficult to measure in the field due to high seasonal variability.
How does drainage influence surface runoff and flooding?
Rainfall provides water for surface runoff and infiltrating the soil. The route water takes as it flows through the landscape plays a very important role in the amount and rate of total runoff, and this is greatly affected by land use.
When natural vegetation is disturbed or converted into field crops and pasture, peak runoff rates at the field edge can dramatically increase. Some surface drainage practices often accompany these conversions.
In general, subsurface drainage tends to decrease surface runoff (sometimes one- to three-fold) and decrease peak surface runoff rates compared to surface-drained or undrained land.
The decrease occurs because water flows more slowly through the soil to reach the drainage system (and eventually the outlet) than it would as surface runoff. The later arrival of drainage flow may cause the overall peak outflow (surface plus drainage) to decrease.
Moreover, when the amount of runoff reduces, its flow speed may also decrease. While these processes are well understood and documented at field and farm scales, flooding is a watershed-scale phenomenon.
As we look at larger and larger landscapes, the increasing complexity of watershed hydrology makes it more difficult to make statements about drainage that hold true for all watersheds, at all scales and at all times. However, it can be said that the potential for subsurface drainage to reduce peak flow rates at the field scale doesn’t support the notion that subsurface drainage exacerbates flooding at larger scales.
It should also be noted that most researchers agree that large-scale, basin-wide floods, such as those of 1993 and 1997 in Minnesota, are largely attributable to catastrophic precipitation, not the presence of subsurface or surface drainage systems.
What’s meant by the “sponge effect” of subsurface drainage?
The combined effect of subsurface drainage and water removal by a healthy, deep-rooted crop increases storage capacity for water infiltration into the soil, compared to undrained soils with a high water table.
Depending on the rainfall’s timing, depth and intensity, more water has a chance to infiltrate a drained soil compared to a poorly drained soil. This increased storage capacity is often referred to as the sponge effect.
The extent to which the effect is realized depends on soil type, crop, time of year and both rainfall and soil moisture characteristics prior to and during precipitation. In poorly drained soils with a high water table, subsurface drainage lowers the water table and increases the empty (air-filled) pore space available for infiltrating water.
The deeper, healthier plant root structure that’s promoted by drainage further enhances this effect by removing still more water from the soil profile, creating more empty pore space. The combined effect of subsurface drainage and crop growth is most apparent from middle to late growing season.
Skaggs, R.W., Breve, M.A., & Gilliam, J.W. (1994). Hydrologic and water quality impacts of agricultural drainage. Critical Reviews in Environmental Science and Technology, 24(1), 1-32.
Reviewed in 2018


