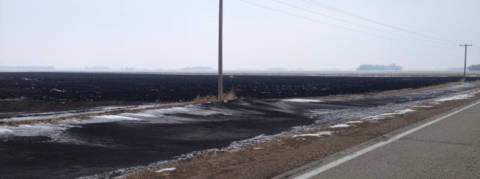
What you need to know
-
Leave residue standing to protect the soil surface.
-
Reduce tillage to improve soil aggregation.
-
Use cover crops and perennial crops.
-
Maintain shelter belts to reduce wind speeds.
Soil loss via wind erosion cuts your profits and reduces productivity by removing a non-renewable crop production resource. Erosion is very costly because the nutrients it removes must be replaced.
Plus, it reduces the depth of productive soil, lowering the water-holding capacity. By controlling wind erosion, you’ll inevitably control water erosion as well.
About wind erosion
Soil is a non-renewable resource and cannot be built within our lifetime. When it’s gone, it’s gone. One hundred percent of our global food needs are farmed on only 11 percent of the world’s land – making soil protection crucial.
While erosion is a natural process, cultivation of the prairie and the dominance of annual crops have significantly sped up soil loss. Some estimate that as much as 19 inches of topsoil has been eroded from agricultural fields. This severely diminishes your soil productivity.
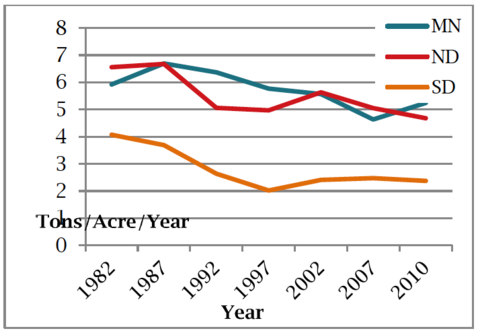
In Minnesota, the average wind erosion rate is 5.2 tons of soil loss per acre per year (Figure 1). North Dakota is slightly lower at 4.7 tons and South Dakota is at 2.4 tons.
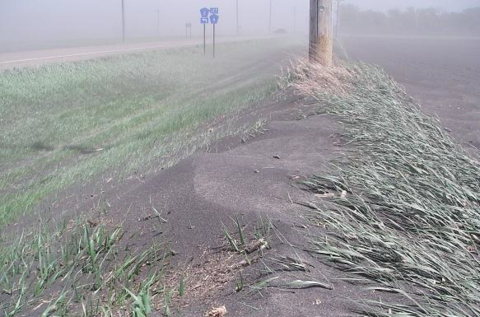
While these levels have decreased in the past three decades, wind erosion is still occurring at detrimental rates (Figure 2). The most severe areas of erosion are well above the general estimates of 5 tons per acre per year.
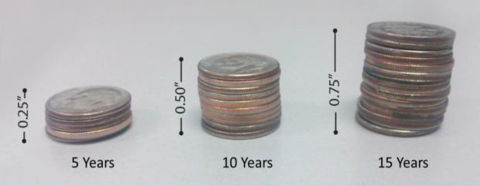
To put it into context, 5 tons of soil across an acre of land is equal to the thickness of a dime. While the loss of a dime’s thickness is scarcely noticeable over one year, it adds up over five, 10 or 15 years (Figure 3).
Why aren’t growers and landowners more alarmed about continual soil loss? Each year there’s topsoil loss, but tillage masks the effects by mixing in subsoil. The topsoil still looks dark, even if it’s not as dark as the year before. Plus, because continual soil loss affects the whole field, there's no way for producers or researchers to assess eroded vs. non-eroded soil color.
Key factors for wind erosion
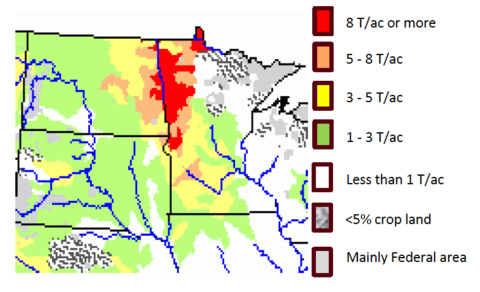
Certain areas of the United States are vulnerable to wind erosion. The Red River Valley area in eastern North Dakota and western Minnesota is particularly susceptible (Figure 4). This is due to a combination of factors.
Wind can pick up speed and intensity along flat landscapes. Western Minnesota and the eastern half of the Dakotas are very level, with little change in topography, and few trees over a wide region.
Tillage increases and accelerates the breaking apart of soil aggregates into individual soil particles. Individual soil particles are lighter and more easily transported by wind than those that are aggregated.
Provide a physical barrier on the soil surface to protect against wind erosion. The more cover, the better the protection. Standing residue is more effective at slowing the wind than chopped residue. In 2007, one third of Minnesota cropland was aggressively tilled, leaving 85 percent of the soil predisposed to erosion.
Short-season or rowed crops offer little soil protection until the crop has canopied. After fall tillage, a majority of the eastern North Dakota and western Minnesota fields are left unprotected for six to nine months of the year. A perennial crop offers a dense mat and increased residue cover to protect the soil.
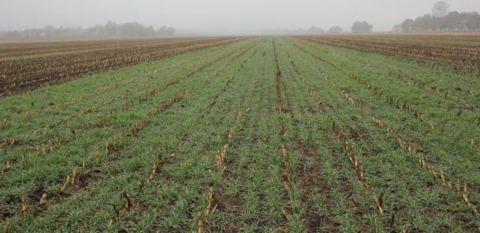
In row-crop systems, including a cover crop in the rotation offers a longer period of soil protection and other benefits (Figure 5).
Carbonates are natural in many of the soils in western Minnesota and in the Red River Valley. Carbonate minerals separate particles from one another, making the soils particularly vulnerable to wind erosion.
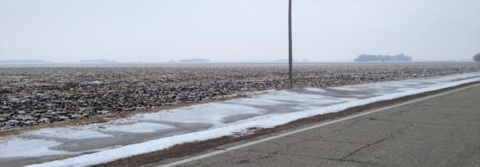
Soil’s heavier components, sand and silt, are moved to a lesser degree and are deposited shorter distances from the source. You’ll see them accumulated in ditches, along fence rows or anywhere the wind slows down.
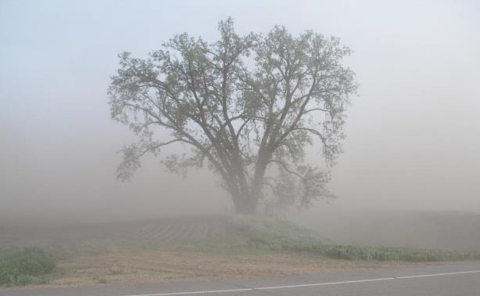
However, you’ll see little clay in the ditch because most of it’s suspended in the air and transported greater distances (Figure 6). Clay is the dominant soil texture in the Red River Valley.
Impact of wind erosion
The most productive soil, called topsoil, is near the surface. The loss of topsoil leads to less healthy and less fertile soil, resulting in lower yields and more commercial fertilizer needed to make up the loss.
Soil samples were collected in six field ditches across western Minnesota to understand how much soil was being deposited in ditches.
Analysis shows a range in accumulation of 2.6 to 32.6 tons of soil in one acre of ditch (Table 1). The soil’s average nutrient content was 55 pounds of total nitrogen, 13 pounds of total phosphorus and almost 37 pounds of total potassium.
$35 in the ditch
At 2018 fertilizer prices, that’s a loss of almost $35 into the ditch. This doesn’t take into account the soil and nutrients that were blown further away with the clay, which is often at least ten times more fertile than what ends up in the ditch.
Table 1: Total nutrients and windblown soil collected in the field ditch
| Soil | Total nitrogen | Total phosphorus | Total potassium | |
|---|---|---|---|---|
| Ditch 1 | 2.6 tons per acre | 10.3 pounds per acre | 3.2 pounds per acre | 8.0 pounds per acre |
| Ditch 2 | 2.8 tons per acre | 12.1 pounds per acre | 3.6 pounds per acre | 8.7 pounds per acre |
| Ditch 3 | 1.6 tons per acre | 8.4 pounds per acre | 1.9 pounds per acre | 4.9 pounds per acre |
| Ditch 4 | 32.6 tons per acre | 172.9 pounds per acre | 46.9 pounds per acre | 124.4 pounds per acre |
| Ditch 5 | 5.5 tons per acre | 23.5 pounds per acre | 7.2 pounds per acre | 18.0 pounds per acre |
| Ditch 6 | 9.3 tons per acre | 102.6 pounds per acre | 12.9 pounds per acre | 56.3 pounds per acre |
| Average | 9.1 tons per acre | 55.0 pounds per acre | 12.6 pounds per acre | 36.7 pounds per acre |
When the soil isn’t protected either by residue or the crop’s canopy, crops may be sandblasted by blowing soil.
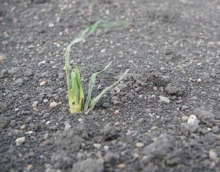
This can open up holes in the plant to allow for entry of diseases such as Goss’s Wilt in corn. Blowing soil can also slice through young emerging plants, which forces producers to decide whether to replant.
The immediate health hazard is the suspension and movement of very small particles in the air, which have been linked to increased asthma and other lung ailments in humans.
Soil particles deposited in surface water contain nitrogen and phosphorus, which cause algal blooms in lakes, rivers and bays. When algae die, they decompose and remove oxygen from the water (hypoxia) and cause fish deaths.
Ditches filled with eroded topsoil restrict field drainage and can lower crop yields from higher water tables and increase soluble salts in fields. Dredging streams to ease this problem is costly and wreaks havoc on aquatic plant and animal communities.
How to reduce wind erosion
Keep your soil covered and reduce the wind speed to prevent wind from removing your valuable topsoil.
1. Reduce the number of tillage passes and intensity. Leaving residue on the soil surface protects the soil from blowing away. You can virtually eliminate erosion on most fields with sufficient residue levels (Figures 8 and 9).
2. Add a cover crop after a short-season crop. This is an excellent way to protect the soil through the winter and early spring months. Ryegrass is fairly inexpensive, easy to grow and provides excellent coverage from wind and water erosion.
3. Leave residue standing. This is an effective way to slow down wind speed. For example, raise the cutting height for small grains. Also, if chopping residue, leave alternating strips of un-chopped stalks.
4. Plant vegetative buffer strips in erosive areas to trap sediment and slow wind speeds.
5. Use living windbreaks or shelterbelts, which are rows of trees and shrubs that effectively slow the wind. When taking out an old windbreak or farm site, plant a new windbreak elsewhere in the field.
There are government programs available to assist with establishment costs and rental payments for these conservation practices.
Soil erosion fact sheet. (2002). Minnesota Board of Water and Soil Resources.
U.S. Department of Agriculture Natural Resources Conservation Service (USDA-NRCS). (1997). National resources inventory summary report.
USDA-NRCS. (2010). 2010 national resources inventory summary report.
World DataBank. (2011). Arable land (% of land area).
Reviewed in 2018


