What you need to know
- Using a preemergence (PRE) herbicide led to greater early-season weed control, compared to postemergence (POST) glyphosate-only applications.
- Using PRE herbicides didn’t affect soybean plant stands.
- A couple sites that didn’t use a PRE herbicide experienced weed escapes at harvest.
Using a preemergence (PRE) herbicide is a key strategy for preventing and managing resistant weed populations. University of Minnesota research shows using a PRE herbicide in soybean led to greater weed control without affecting yield, compared to solely relying on postemergence (POST) applications.
Understanding preemergence (PRE) herbicides
Preemergence (PRE) herbicide use dramatically dropped when glyphosate-resistant crops entered the marketplace.
Since then, relying solely on postemergence applications of glyphosate expose weed populations to oversimplified weed management.
Since then, crop producers have heavily relied on postemergence (POST) applications of glyphosate, exposing weed populations to oversimplified weed management. After years of the program, producers have increasingly reported decreased weed control and resistance to glyphosate.
Historically, PRE herbicide use has been lower in soybean than in corn. Surveys of private pesticide applicators across southern Minnesota illustrate this. For example, in 2011, 61 percent of growers indicated they used a POST-only system in soybean, while 40 percent indicated the same in corn.
Using a PRE herbicide is a key strategy for preventing and managing resistant weed populations.
Advantages of PRE herbicides
Reduces:
Weed density.
Weed species diversity.
Weed size at the time of postemergence application.
Increases:
Yield potential, by reducing early-season weed competition
Herbicide-adjuvant compatibility.
Early-season weed canopy in soybean.
Nitrogen efficiency in corn.
Consistency of weed control.
Diversity in herbicide program, by introducing different sites of action.
Research: Effects of including a PRE herbicide application in soybean
To help demonstrate the benefits of using a PRE herbicide in soybean, the University of Minnesota initiated the PRE Challenge in 2012. The research and demonstration project aimed to illustrate how applying PRE herbicide in soybean affected weed control, yield and economics, when compared to a POST, glyphosate-only program.
Researchers established trials at:
Six on-farm locations across southern Minnesota in 2012: Luverne, Pipestone, Windom, Albert Lea, Nerstrand and Brownton.
Four on-farm locations in 2013: Luverne, Pipestone, Fairfax and Gaylord.
In 2012, significant rainfall events at the Brownton location resulted in areas of the plot drowning out, so this site wasn’t taken to yield. Planting issues at the Luverne location and PRE application issues at the Windom site also prevented these sites from being included in the yield results.
Because of this, results shown are for the Albert Lea, Nerstrand and Pipestone locations only in 2012. In 2013, data is shown for the Luverne, Fairfax and Pipestone locations, due to POST application issues in Gaylord.
Treatments were arranged in a randomized complete block design with four replications. Plot length was a minimum of 400 feet. A field-scale, standard combine harvested the center portion of each treatment.
Treatments consisted of:
A PRE herbicide application followed by POST glyphosate.
Only a POST glyphosate application.
Producers applied POST at the same time and rate across both treatments. All other factors across treatments were the same, including fertilizer program, soybean variety, insecticide application (if applicable) and harvest date. Cooperators selected the herbicide program based on their needs.
- Weed density and height were recorded by species prior to POST application at each site, and again within about 14 days after POST application.
- Plots were evaluated prior to harvest for weed escapes.
- Yield was determined at harvest by using a weigh wagon to collect grain weight.
- A hand-held moisture meter was used to determine grain moisture.
- Yields were standardized to a 13.5 percent moisture content across plots and statistical analysis (ANOVA) was conducted on results when applicable.
Research results
Soybean stands and soybean population loss
At each site, applying a PRE herbicide had no impact on soybean stand or stand loss.
Early in the season, soybean stands ranged from 90,000 to 141,200 plants per acre (Table 1). By the end of the season, soybean stands ranged from 86,900 to 136,000 plants per acre. Percent population loss ranged from a low of 1.7 percent to a high of 9.4 percent, but was similar across treated and untreated plots at each site.
Weed populations
Common lambsquarters and waterhemp/pigweed species were the most common weeds at each site.
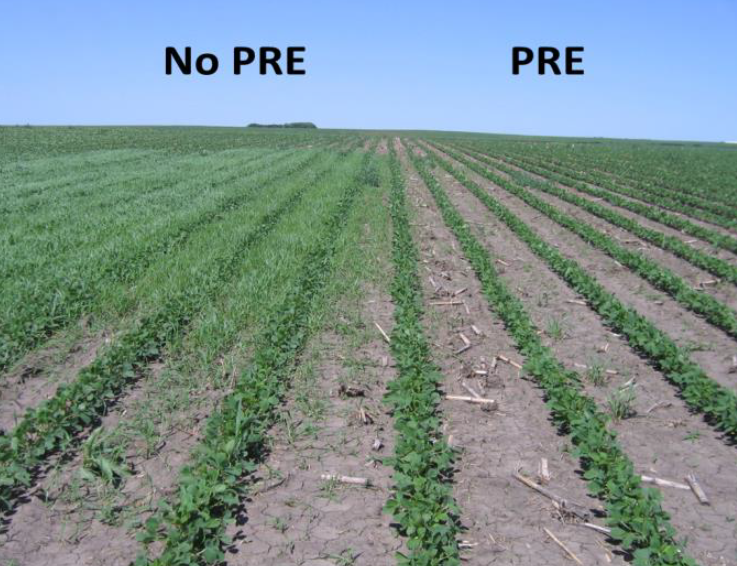
Although weed populations were relatively low overall, weed populations were greater where no PRE herbicide was applied (Table 2). Weed patches also often were observed where no PRE was used, such as at the Pipestone location in 2012 (Figure 1).
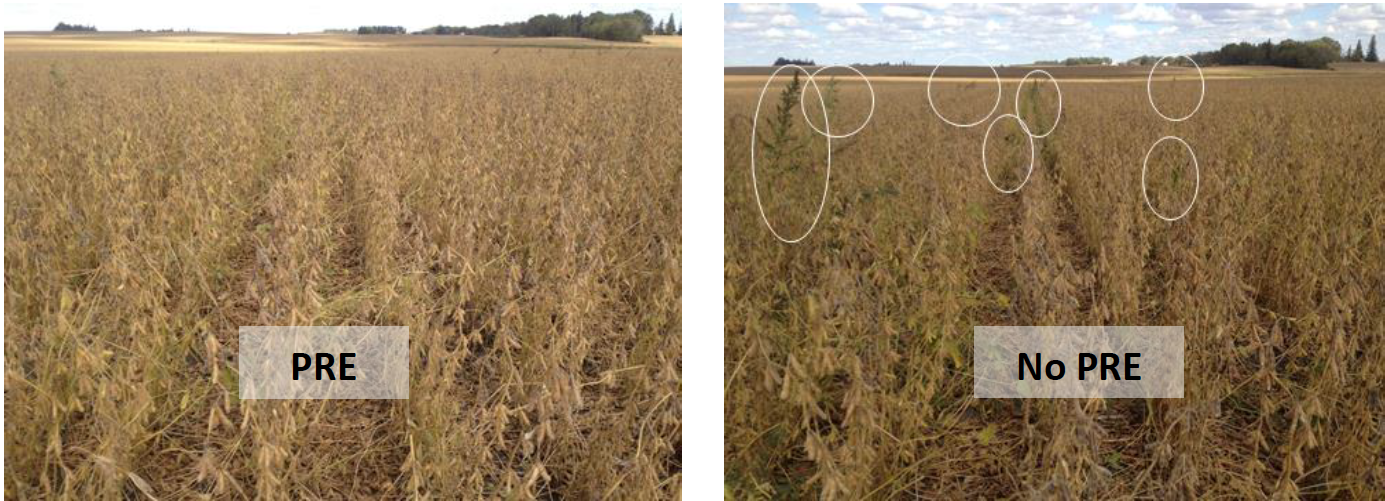
Although POST applications controlled most weeds, waterhemp survivors were observed at a couple locations. The Nerstrand site, for example, didn’t apply a PRE herbicide and had waterhemp plants at harvest. No escapes were observed in the PRE treatments (Figure 2).
While resistance to glyphosate in waterhemp hadn’t officially been confirmed at any sites, glyphosate-resistance in waterhemp is an expanding problem in Minnesota.
Weed escapes at harvest were observed at a couple of sites that didn’t use a PRE herbicide. Seed production from these plants can help replenish the weed seedbank, which can lead to long-term weed control challenges. Preventing the weed seedbank from replenishing also is a key resistance management strategy.
Yield
At all locations, yields weren’t affected by the inclusion of a PRE herbicide in the weed management program. Yield ranged from 45.7 to 67.3 bushels per acre, with drought conditions contributing to lower yields at the Pipestone location in 2012 (Table 1).
While yields weren’t greater where PRE herbicides were used in these trials, yield advantages have been observed in previous University of Minnesota research.
If weather or other complications delayed POST applications, early-season weed competition would’ve been more likely to impact yield. PRE herbicides may not result in a yield benefit in a given year, but using them provides other benefits that enhance weed control in the long-run.
Table 1 shows values across locations in 2012 and 2013. At all locations, all variables were not significant (NS) at p = 0.05.
Table 1: Early soybean stand, pre-harvest soybean stand, percent population loss and soybean yield
| Year | Location and product | Treatment | Early stand | Pre-harvest stand | Population loss | Yield |
|---|---|---|---|---|---|---|
| 2012 | Pipestone (PRE = Prefix at 2 pints per acre) | No PRE | 127,300 plants per acre | 125,200 plants per acre | 1.7% | 46.0 bushels per acre |
| 2012 | Pipestone (PRE = Prefix at 2 pints per acre) | PRE | 134,600 plants per acre | 125,200 plants per acre | 6.8% | 45.7 bushels per acre |
| 2012 | Nerstrand (PRE = Verdict at 5 ounces per acre + Outlook at 10 ounces per acre) | No PRE | 92,900 plants per acre | 86,900 plants per acre | 6.4% | 63.5 bushels per acre |
| 2012 | Nerstrand (PRE = Verdict at 5 ounces per acre + Outlook at 10 ounces per acre) | PRE | 90,000 plants per acre | 88,000 plants per acre | 2.2% | 63.4 bushels per acre |
| 2012 | Albert Lea (PRE = Verdict at 5 ounces per acre + Outlook at 10 ounces per acre) | No PRE | 131,400 plants per acre | 119,100 plants per acre | 9.4% | 57.0 bushels per acre |
| 2012 | Albert Lea (PRE = Verdict at 5 ounces per acre + Outlook at 10 ounces per acre) | PRE | 132,900 plants per acre | 120,500 plants per acre | 9.2% | 54.9 bushels per acre |
| 2013 | Pipestone (PRE = Prefix at 2 pints per acre) | No PRE | 122,300 plants per acre | 111,800 plants per acre | 8.5% | 60.1 bushels per acre |
| 2013 | Pipestone (PRE = Prefix at 2 pints per acre) | PRE | 129,200 plants per acre | 119,400 plants per acre | 7.5% | 60.4 bushels per acre |
| 2013 | Luverne (PRE = Authority First at 3.2 ounces per acre) | No PRE | 140,100 plants per acre | 136,00 plants per acre | 2.9% | 67.3 bushels per acre |
| 2013 | Luverne (PRE = Authority First at 3.2 ounces per acre) | PRE | 141,200 plants per acre | 132,600 plants per acre | 6.1% | 66.1 bushels per acre |
| 2013 | Fairfax (PRE = Dual II at 2 pints per acre) | No PRE | 132,400 plants per acre | 129,00 plants per acre | 2.5% | 58.5 bushels per acre |
| 2013 | Fairfax (PRE = Dual II at 2 pints per acre) | PRE | 138,100 plants per acre | 130,00 plants per acre | 5.9% | 58.2 bushels per acre |
Table 2 shows the number of weeds per 80 square feet across subsamples and replications. The total number of weeds present includes less common weed species not separately listed on the table.
*Represents burndown and tillage escapes in the total area, equal to approximately one acre.
Table 2: Total number of weeds prior to postemergence application
| Year | Location and product | Treatment | Common lambsquarters | Waterhemp and pigweed | Grass | Total number of weeds present |
|---|---|---|---|---|---|---|
| 2012 | Pipestone (Prefix at 2 pints per acre) | No PRE | 44 weeds | 11 weeds | 14 weeds | 126 weeds |
| 2012 | Pipestone (Prefix at 2 pints per acre) | PRE | 3 weeds | 0 weeds | 1 weeds | 4 weeds |
| 2012 | Nerstrand (Verdict at 5 ounces per acre + Outlook at 10 ounces per acre) | No PRE | 75 weeds | 24 weeds | 3 weeds | 105 weeds |
| 2012 | Nerstrand (Verdict at 5 ounces per acre + Outlook at 10 ounces per acre) | PRE | 0 weeds | 0 weeds | 0 weeds | 0 weeds |
| 2012 | Albert Lea (Verdict at 5 ounces per acre + Outlook at 10 ounces per acre) | No PRE | 36* weeds | 0 weeds | 0 weeds | 36* weeds |
| 2012 | Albert Lea (Verdict at 5 ounces per acre + Outlook at 10 ounces per acre) | PRE | 3* weeds | 0 weeds | 0 weeds | 3* weeds |
| 2013 | Pipestone (Prefix at 2 pints per acre) | No PRE | 10 weeds | 3 weeds | 0 weeds | 26 weeds |
| 2013 | Pipestone (Prefix at 2 pints per acre) | PRE | 0 weeds | 0 weeds | 0 weeds | 0 weeds |
| 2013 | Luverne (Authority First at 3.2 ounces per acre) | No PRE | 3 weeds | 7 weeds | 0 weeds | 23 weeds |
| 2013 | Luverne (Authority First at 3.2 ounces per acre) | PRE | 0 weeds | 0 weeds | 0 weeds | 3 weeds |
| 2013 | Fairfax (Dual II at 2 pints per acre) | No PRE | 1 weeds | 26 weeds | 2 weeds | 28 weeds |
| 2013 | Fairfax (Dual II at 2 pints per acre) | PRE | 1 weeds | 1 weeds | 0 weeds | 2 weeds |
Behnken, L. Breitenbach, F., Miller, R., Stahl, L., & Nicolai, D. (2011). IPM Assessment.
Reviewed in 2018