Profitable corn yields are the result of wisely using several production inputs. Effectively, but not excessively, using fertilizer is just one part of the crop production puzzle.
Fertilizer management involves more than selecting an appropriate rate. Placement choice is a major consideration. This is especially true for immobile nutrients such as phosphorus, potassium and zinc.
Understanding banded fertilizer and other placement methods
There are many choices for fertilizer placement, and some terms can be confusing. Placement options are briefly described as follows.
Broadcast
With this placement, fertilizer is broadcast on the soil surface. There’s usually some incorporation with either primary or light tillage.
Starter
Starter describes fertilizer placed in a band near the seed in the planting operation. This band can be placed at various distances from the seed.
Pop-up
This placement option describes fertilizer placed in contact with the corn seed. Both liquid and dry materials can be used as pop-up fertilizer.
Deep band
Deep band usually describes placing immobile nutrients in a band 4 to 6 inches below the soil surface. Conservation tillage systems frequently use this placement method.
Surface band
This placement option refers to placing the fertilizer in a band on the soil surface. This banded fertilizer is then incorporated with either a primary or secondary tillage operation.
Dual band
This combines a preplant application of anhydrous ammonia and some mixed liquid fertilizer. This placement method uses two lines attached to one shank. This placement option is rarely used in Minnesota, and won’t be further discussed.
Compared to broadcast and incorporated fertilizer, the banded application minimizes contact between soil and fertilizer. This reduces fixation or tie-up of phosphorus and potassium in the soil.
How nutrients get tied up
Phosphorus fixation varies with soil pH:
Very acid soils (pH is less than 5.0): Fixation occurs as insoluble iron and aluminum phosphates.
Calcareous soils (pH is more than 7.4): Fixation takes place as insoluble calcium phosphates.
The tie-up of potassium doesn’t vary with soil pH. Instead, the type of clay in the soil is important. A variety of clays affect potassium fixation:
Southeastern Minnesota soils: Contain substantial amounts of clay that fix potassium.
Western Minnesota soils: The types of clays that fix K aren’t dominant.
How bands reduce fixation
Crops such as corn and small grains can more efficiently use phosphorus and potassium if it’s applied in a band. This reduces contact between soil and fertilizer, ultimately reducing the fixation or tie-up of these nutrients.
This principle hasn’t been verified by field trials with soybeans.
Effectiveness of band-applied phosphate for corn production*
| P2O5 | Placement | Yield average of two years |
|---|---|---|
| 0 lbs. per acre | -- | 122 a** bushels per acre |
| 40 lbs. per acre | Starter | 142 b bushels per acre |
| 200 lbs. per acre | Broadcast | 146 b bushels per acre |
*Researchers conducted the study at the University of Minnesota Southwest Research and Outreach Center in Lamberton. Soil test P was low. **Treatment averages followed by the same letter aren’t significantly different at the .05 confidence level.
Effectiveness of band-applied potash for corn production*
| K2O | Placement | Yield average of two years |
|---|---|---|
| 0 lbs. per acre | 151 | 117 a** bushels per acre |
| 40 lbs. per acre | Starter | 137 b bushels per acre |
| 200 lbs. per acre | Broadcast | 134 b bushels per acre |
*Research was conducted in fields of cooperating farmers in Goodhue County. Soil test K was low. **Treatment averages followed by the same letter aren’t significantly different at the .05 confidence level.
Fertilizer rates by placement approach
Producers can use less phosphorus and potassium if they apply it in a band, thanks to the method’s improved efficiency for corn. Using lower rates of phosphorus and potassium in a band reduces the amount of money spent on phosphate and potash fertilizers.
Recommended rates of P2O5 to apply per acre, based on yield goal and soil test P:
- Very low: Soil test P is 0 to 5 ppm Bray or 0 to 3 ppm Olsen.
- Low: Soil test P is 6 to 10 ppm Bray or 4 to 7 ppm Olsen.
- Medium: Soil test P is 11 to 15 ppm Bray or 8 to 11 ppm Olsen.
- High: Soil test P is 16 to 20 ppm Bray or 12 to 15 ppm Olsen.
- Very high: Soil test P is 21+ ppm Bray or 16+ ppm Olsen.
Phosphate guidelines for Minnesota corn production
| Yield goal | Broadcast, very low soil test P | Band, very low soil test P | Broadcast, low soil test P | Band, low soil test P | Broadcast, medium soil test P | Band, medium soil test P | Broadcast, high soil test P | Band, high soil test P | Broadcast, very high soil test P | Band, very high soil test P |
|---|---|---|---|---|---|---|---|---|---|---|
| 70-90 bushels per acre | 50 lbs. of P2O5 | 25 lbs. of P2O5 | 35 lbs. of P2O5 | 20 lbs. of P2O5 | 20 lbs. of P2O5 | 15 lbs. of P2O5 | 10 lbs. of P2O5 | 10-15 lbs. of P2O5 | 0 lbs. of P2O5 | 10-15 lbs. of P2O5 |
| 91-110 bushels per acre | 60 lbs. of P2O5 | 30 lbs. of P2O5 | 40 lbs. of P2O5 | 20 lbs. of P2O5 | 25 lbs. of P2O5 | 20 lbs. of P2O5 | 10 lbs. of P2O5 | 10-15 lbs. of P2O5 | 0 lbs. of P2O5 | 10-15 lbs. of P2O5 |
| 111-130 bushels per acre | 75 lbs. of P2O5 | 40 lbs. of P2O5 | 50 lbs. of P2O5 | 25 lbs. of P2O5 | 30 lbs. of P2O5 | 20 lbs. of P2O5 | 10 lbs. of P2O5 | 10-15 lbs. of P2O5 | 0 lbs. of P2O5 | 10-15 lbs. of P2O5 |
| 131-150 bushels per acre | 85 lbs. of P2O5 | 45 lbs. of P2O5 | 60 lbs. of P2O5 | 30 lbs. of P2O5 | 35 lbs. of P2O5 | 25 lbs. of P2O5 | 10 lbs. of P2O5 | 10-15 lbs. of P2O5 | 0 lbs. of P2O5 | 10-15 lbs. of P2O5 |
| 151-170 bushels per acre | 100 lbs. of P2O5 | 50 lbs. of P2O5 | 70 lbs. of P2O5 | 35 lbs. of P2O5 | 40 lbs. of P2O5 | 30 lbs. of P2O5 | 15 lbs. of P2O5 | 10-15 lbs. of P2O5 | 0 lbs. of P2O5 | 10-15 lbs. of P2O5 |
| 171-190 bushels per acre | 110 lbs. of P2O5 | 55 lbs. of P2O5 | 75 lbs. of P2O5 | 40 lbs. of P2O5 | 45 lbs. of P2O5 | 30 lbs. of P2O5 | 15 lbs. of P2O5 | 10-15 lbs. of P2O5 | 0 lbs. of P2O5 | 10-15 lbs. of P2O5 |
| 191+ bushels per acre | 120 lbs. of P2O5 | 60 lbs. of P2O5 | 85 lbs. of P2O5 | 45 lbs. of P2O5 | 50 lbs. of P2O5 | 35 lbs. of P2O5 | 15 lbs. of P2O5 | 10-15 lbs. of P2O5 | 0 lbs. of P2O5 | 10-15 lbs. of P2O5 |
Use one of the following equations if you want a P2O5 recommendation for a specific soil test value and a specific yield goal:
- Recommended P2O5 = [0.700 - .035 (Bray P ppm)] (yield goal)
- Recommended P2O5 = [0.700 - .044 (Olsen P ppm)] (yield goal)
No phosphate fertilizer is recommended if the soil test for P is higher than 25 parts per million (ppm) with the Bray test or 20 ppm with the Olsen test.
Use the following equation if you want a K2O recommendation for a specific soil test value and a specific yield goal:
- Recommended K2O = [1.166 - .0073 (Soil test K in ppm)] (yield goal)
No potash fertilizer is recommended if the soil test for K is 175 ppm or higher.
Potash guidelines
| Yield goal | Broadcast, very low soil test K (0-40 ppm) | Band, very low soil test K (0-40 ppm) | Broadcast, low soil test K (41-80 ppm) | Band, low soil test K (41-80 ppm) | Broadcast, medium soil test K (81-120 ppm) | Band, medium soil test K (81-120 ppm) | Broadcast, high soil test K (121-160 ppm) | Band, high soil test K (121-160 ppm) | Broadcast, very high soil test K (161+ ppm) | Band, very high soil test K (161+ ppm) |
|---|---|---|---|---|---|---|---|---|---|---|
| 70-90 bushels per acre | 80 lbs. of K2O per acre | 40 lbs. of K2O per acre | 60 lbs. of K2O per acre | 30 lbs. of K2O per acre | 35 lbs. of K2O per acre | 20 lbs. of K2O per acre | 15 lbs. of K2O per acre | 10-15 lbs. of K2O per acre | 0 lbs. of K2O per acre | 10-15 lbs. of K2O per acre |
| 91-110 bushels per acre | 100 lbs. of K2O per acre | 50 lbs. of K2O per acre | 75 lbs. of K2O per acre | 40 lbs. of K2O per acre | 45 lbs. of K2O per acre | 30 lbs. of K2O per acre | 15 lbs. of K2O per acre | 10-15 lbs. of K2O per acre | 0 lbs. of K2O per acre | 10-15 lbs. of K2O per acre |
| 111-130 bushels per acre | 120 lbs. of K2O per acre | 60 lbs. of K2O per acre | 90 lbs. of K2O per acre | 45 lbs. of K2O per acre | 50 lbs. of K2O per acre | 30 lbs. of K2O per acre | 20 lbs. of K2O per acre | 10-15 lbs. of K2O per acre | 0 lbs. of K2O per acre | 10-15 lbs. of K2O per acre |
| 131-150 bushels per acre | 145 lbs. of K2O per acre | 75 lbs. of K2O per acre | 105 lbs. of K2O per acre | 55 lbs. of K2O per acre | 60 lbs. of K2O per acre | 40 lbs. of K2O per acre | 20 lbs. of K2O per acre | 10-15 lbs. of K2O per acre | 0 lbs. of K2O per acre | 10-15 lbs. of K2O per acre |
| 151-170 bushels per acre | 165 lbs. of K2O per acre | 95 lbs. of K2O per acre | 120 lbs. of K2O per acre | 60 lbs. of K2O per acre | 70 lbs. of K2O per acre | 40 lbs. of K2O per acre | 25 lbs. of K2O per acre | 10-15 lbs. of K2O per acre | 0 lbs. of K2O per acre | 10-15 lbs. of K2O per acre |
| 171-190 bushels per acre | 185 lbs. of K2O per acre | 90 lbs. of K2O per acre | 135 lbs. of K2O per acre | 70 lbs. of K2O per acre | 80 lbs. of K2O per acre | 50 lbs. of K2O per acre | 25 lbs. of K2O per acre | 10-15 lbs. of K2O per acre | 0 lbs. of K2O per acre | 10-15 lbs. of K2O per acre |
| 191+ bushels per acre | 205 lbs. of K2O per acre | 105 lbs. of K2O per acre | 160 lbs. of K2O per acre | 80 lbs. of K2O per acre | 90 lbs. of K2O per acre | 55 lbs. of K2O per acre | 30 lbs. of K2O per acre | 10-15 lbs. of K2O per acre | 0 lbs. of K2O per acre | 10-15 lbs. of K2O per acre |
Strategies: Fertilizer placement
There’s no firm rule dictating where to place the banded fertilizer in relation to the corn seed. The fertilizer supplying phosphate or potash can be placed:
- To the side of the seed.
- To the side of and below the seed.
- Below the seed.
Phosphorus and potassium are immobile in soils, so crops will get little benefit from these nutrients if they’re placed or applied above the level of the seed either at the time of planting or after planting.
The placement of the immobile nutrients in a band below the seed is a highly recommended practice when corn is grown in ridge-till and no-till planting systems. This banded placement is frequently referred to as a “deep band.”
In Minnesota, this deep band or subsurface band is usually applied in the fall of the soybean year in the rotation. The corn can be planted directly above this band. This placement of the immobile nutrients substitutes for a starter fertilizer.
Recommended phosphate rates with this placement option are the same as the rates suggested for starter application (Table 1). Compared to conventional tillage systems, higher rates of potash are needed for corn planted in the conservation tillage production systems.
For K soil test values in the range of 100 to 180 ppm, a rate of 40 to 50 pounds of K2O per acre per year is suggested for the corn-soybean rotation. This annual rate can be doubled and applied in the fall of the soybean year and will be satisfactory for two years of production.
If soil test values for K are less than 100 ppm, an annual banded application of 80 pounds of K2O per acre is suggested for the conservation tillage production systems.
Where to place the fertilizer
Placing a fertilizer near the seed at planting is the more traditional way to use banded fertilizer.
Early planter attachments were engineered to place the fertilizer 2 inches to the side of and 2 inches below the seed. This specific placement isn’t essential for using a starter fertilizer.
It’s important to place this starter band below the level of the seed. The distance between the seed and fertilizer can vary from 1 to 3 inches. Some of the starter effect is lost if the banded fertilizer is placed more than 3 inches from the seed. To assure crop safety, a minimum distance of 1 inch between seed and fertilizer is suggested.
Nutrient-specific guidelines
There can be some damage to germination and emergence if excessive amounts of nitrogen or potash are placed too close to the seed. Phosphate has no negative effect on germination.
You can apply the amount of phosphate needed for optimum yield in a band near the seed if the amounts of either nitrogen or potash applied with this phosphate aren’t too high. The amount of nitrogen applied within 1 inch of the seed should be less than 30 pounds per acre.
If applied within 1 inch of the seed, you can use rates of up to 60 pounds of K2O per acre. If you need higher rates of K2O to meet recommendations, the distance between seed and fertilizer should be more than 1 inch.
Placing fertilizer with the seed – known as "pop-up" – is an old concept that’s become more popular in recent years.
This is an excellent placement option for growers who have large planters and can’t use the conventional starter attachments. This placement option is also well-suited for fields with a medium level of soil test P or K. In the medium range, small rates of phosphate or potash are recommended.
Effectiveness of pop-up fertilizer
Recent research measured the effect of applying three rates of three fluid fertilizers in contact with corn seed on emergence and yield. A control (no pop-up used) was also included. Southern Research and Outreach Center in Waseca and the Southwest Research and Outreach Center in Lamberton conducted the study.
The table below summarizes the average effect of pop-up fertilizer on emergence. Except for the application of 7-21-7 at a rate of 15 gallons per acre, none of the fluids studied negatively affected emergence. Values are averages for several locations over three years. Control means that no fertilizer was applied with the seed.
The effect of rate of application of three fluid fertilizers on corn emergence
| Fertilizer grade | Application rate: 5 gallons per acre | Application rate: 10 gallons per acre | Application rate: 15 gallons per acre |
|---|---|---|---|
| 7-21-7 | 102% control | 101% control | 90% control |
| 4-10-10 | 105% control | 101% control | 99% control |
| 10-34-0 | 101% control | 102% control | 101% control |
The next table summarizes the average corn yields from the same study. Compared to the control, none of the fluids applied negatively affected yield.
Even though the selected sites had high soil test values for P and K, there was a small, consistent increase in yield when the 10-34-0 was applied in contact with the seed. The stand reduction caused by using the highest rate of 7-21-7 wasn’t reflected in yield.
How application rate of three fluid fertilizers affects corn yield
| Fertilizer grade | Application rate: 5 gallons per acre | Application rate: 5 gallons per acre | Application rate: 10 gallons per acre | Application rate: 15 gallons per acre |
|---|---|---|---|---|
| none | 147 bushels per acre | -- | -- | -- |
| 7-21-7 | -- | 147 bushels per acre | 149 bushels per acre | -- |
| 4-10-10 | -- | 101 bushels per acre | 145 bushels per acre | 149 bushels per acre |
| 10-34-0 | -- | 152 bushels per acre | 150 bushels per acre | 148 bushels per acre |
Soil moisture content
There was ample moisture in the seed zone at planting at both locations. With this amount of moisture, rates of 10-34-0 up to 10 gallons per acre should be safe for corn planting in Minnesota. If soils are dry at planting, there might be some damage from using pop-up fertilizer.
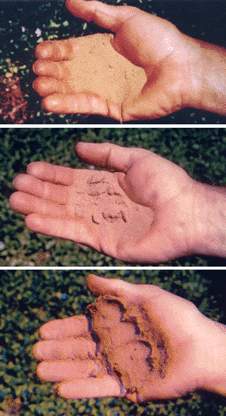
How to measure
There’s no easy method for measuring soil moisture content in the field. Squeezing the soil taken from the planting depth in the palm of your hand and then releasing it is a useful test.
Soil particles will stick together as water is added to the soil. The water-holding capacity of sandy soils is low and small changes in the percent of water-holding capacity filled with water produce major changes in how the soil appears in a hand.
Minnesota soils
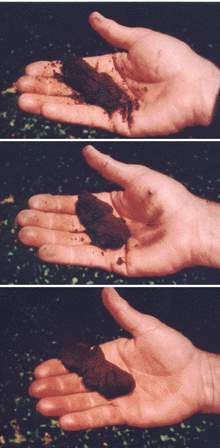
In Minnesota, soils with a silt loam, silty clay loam and clay loam texture are described as fine-textured. These fine-textured soils stick together as the percentage of water-holding capacity filled with water increases. When more than 50 percent of the water-holding capacity is filled with water, it's easy to form a ribbon of soil between finger and thumb.
In Minnesota, sandy soils have the greatest risk for damage from pop-up fertilizer. With fine-textured soils, the potential for damage from pop-up fertilizer is substantially reduced if the moisture content is higher than 25 percent of the water-holding capacity.
Liquid or dry
There’s a continuing debate about using liquid and dry fertilizers in a band. Research shows yields will be equal if a fertilizer with the same analysis is applied in either a liquid or dry form.
Factors to consider
Base the decision for liquid or dry fertilizer on factors such as price, preference for handling and the availability of equipment needed for handling.
Growing plants don’t have a preference for either liquid or dry materials.
In some cases, however, one form of starter may be better than the other. For example, the sulfur concentration in most liquid fertilizers is relatively low because of the chemistry involved in the manufacturing process. So, higher rates of fluid materials are needed to meet the sulfur needs of corn grown on sandy soils.
Dry materials can usually be blended so a product with a higher sulfur concentration can be provided. In such situations, a dry starter is sometimes less expensive because it can supply the needed sulfur while being applied at a lower rate.
Some cautions
The pop-up placement is an effective method for applying phosphate and potash fertilizers. There are, however, some cautions with this placement.
Urea and ammonium thiosulfate
Urea (46-0-0) shouldn’t be applied in contact with corn seeds. This is especially true when the soil is dry.
Urea applied in the seed furrow in a dry sandy soil reduced germination and subsequent yield. By contrast, there was no yield reduction when the 46-0-0 was placed to the side of and below the seed at planting.
Ammonium thiosulfate (12-0-0-26) can also affect emergence if applied in contact with the seed. Avoid contact between these fertilizers and corn seeds.
The effect of urea applied in contact with corn seed on emergence and yield of corn
| N applied with seed | Emerged population | Grain yield |
|---|---|---|
| 0 lbs. per acre | 29,968 plants per acre | 181 bushels per acre |
| 7.5 lbs. per acre | 21,127 plants per acre | 156 bushels per acre |
| 15.0 lbs. per acre | 15,246 plants per acre | 145 bushels per acre |
| 30.0 lbs. per acre | 7,550 plants per acre | 96 bushels per acre |
Reviewed in 2024