Here, you’ll find guidance on selecting a conservation tillage system for corn in a corn-soybean rotation. We share the results of on-farm yield trials conducted across southern Minnesota, as well as management tips for conservation tillage.
Selecting a tillage system requires you to consider many factors, including soil and water conservation, economic return, labor availability and management capability, all of which are specific to the individual farming operation.
About conservation tillage
Conservation tillage systems that leave at least 30 percent residue cover on the soil surface after planting. Reduced-tillage systems have benefits other than soil conservation, such as:
Increased water infiltration.
Increased or sustained organic matter content.
Increased water-holding capacity.
Continued long-term soil productivity.
Less capital investment in equipment and fewer field passes. This reduces the amount of labor and fuel used.
Many agronomic and environmental factors affect agriculture’s impact on soil and water quality in Minnesota.
Annual row crops like corn and soybeans don’t protect the soil from direct raindrop impact until the leaf canopy closes, which is usually mid- to late-June. The potential for water runoff in this period is the greatest. This is because the period from April through June is generally wet in Minnesota, plus soil moisture conditions are at or near field capacity while transpiration rates from row crops are low.
When the impact of raindrops detaches soil particles, runoff can carry them to surface tile inlets and streams. Excessive soil erosion results in lost yield potential over time. It also degrades streams and lakes with phosphorus-induced algal growth and sediment, reducing light penetration and depleting the oxygen necessary for fish.
Maintaining crop residue cover until canopy closure reduces the impact of raindrops that dislodge soil particles, and can reduce the power of runoff water to move soil to streams. Residue is especially effective if left standing, anchored by roots.
However, Minnesota producers have been hesitant to switch over to a higher-residue tillage system for corn. One of the biggest concerns is that increased crop residue levels will result in cooler and wetter soils in the spring, which may delay corn planting on poorly drained soils.
These are typically the glacial till or lacustrine (lake sediment) soils of the state. Delayed planting can reduce yield potential and result in a higher moisture content in grain at harvest. Leaving a high level of residue on the soil has less effect on soybean emergence and growth because soybeans are planted later, when soils are warmer and drier.
The University of Minnesota has researched several reduced-tillage systems to assist you with tillage decision-making for corn following soybeans. Research showed that reduced-tillage systems can enhance residue cover and soil conservation while maintaining or improving corn yields.
In addition, the University of Minnesota research showed that no-till corn following soybeans on glacial-till, heavy clay soils will reduce yields compared to systems that involve some tillage, such as spring field cultivation, fall strip tillage or fall chisel plow.
However, on the well-drained loess soils in southeast Minnesota, research showed no-till corn yields were similar to those of the three reduced tillage systems for corn following soybeans.
On-farm research: Tillage systems
Research on Minnesota farms shows that conservation tillage can greatly reduce soil erosion, with minimal effect on crop yields and often at lower production costs than conventional tillage. With appropriate adjustments to crop management, conservation tillage offers a low-risk way of substantially reducing sediment and phosphorus losses from cropland to streams, rivers and lakes.
Tillage research for corn following soybean conducted on Minnesota farmers' fields in 2004 and 2005 has shown:
Tillage treatments had a greater impact on crop production in the cooler-than-normal growing season (2004) than in the warmer-than-normal growing season (2005).
Grain moisture was significantly higher with reduced tillage systems in 2004, but not in 2005 (data not shown).
Residue coverage after planting corn varied considerably among sites and averaged 60, 47, 29 and 21 percent for no-till, strip-till, one-pass and chisel-plow-plus, respectively.
Significant differences in final plant populations among tillage treatments were rare. When they occurred, they were generally small.
Averaged over years, corn yields were greatest for chisel-plow-plus and strip-till, intermediate for one-pass and least for no-till.
These data showed reduced tillage systems like strip-till can produce yields similar to conventional tillage systems like chisel plow, while maintaining adequate residue cover and reducing the risk of soil erosion.
The University of Minnesota and Monsanto Company, in cooperation with farmers across the state, compared tillage systems for corn following soybeans on farm fields in 2004 and 2005, using producer-owned commercial tillage equipment.
Ten on-farm trials were completed in 2004 and nine in 2005, with an additional site, Sibley-2, planted but lost to wind in 2005 (See Figure 1 and Appendix Tables 1 and 2). All sites were on glacial till-derived soils except for those in Fillmore and Wabasha counties, which were on loess-derived soils.
Plots were field-length strips ranging in width from 500 to 1,000 feet and replicated three times in a randomized, complete-block design. Farmers performed all tillage, planting, spraying and harvesting operations.
Generally, experimental sites were chosen that had high to very high levels of soil test phosphorus (P) and potassium (K), and therefore fertilizer P and K wasn’t needed. Nitrogen fertilizer was spring-applied at University of Minnesota recommended rates. Weeds were managed with label rates of herbicides to minimize their impact on corn production.
Corn grain yields were measured with a weigh wagon. Percent residue cover, stand counts, grain yield and grain moisture were measured in each plot at each site.
Tillage treatments
Four tillage treatments were compared at seven sites in 2004, and six sites in 2005. The treatments were no-tillage, spring field cultivate, fall strip tillage and chisel plow plus spring field cultivate. Two treatments, strip tillage and chisel plow plus spring field cultivate, were compared at an additional three sites each in 2004 and 2005. (See Appendix Tables 7, 8, 9, and 10).
The four tillage systems for corn following soybeans compared in this study are described below, in order of decreasing residue.
1. No tillage (No-till)
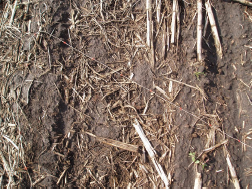
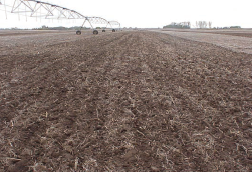
No-till systems leave the greatest amount of residue cover on the soil surface and provide the greatest erosion control (Figure 2). Fertilizers may be broadcast in no-till systems, but band applications at or after planting are preferred. No-till requires complete chemical weed control. Generally, no-till has been successful in Minnesota regions where there’s less precipitation and there are coarse-textured or otherwise well-drained soils.
The no-till treatment received no fall or preplant tillage prior to planting corn. Most sites used planter attachments (row cleaners and/or coulters) on the planters.
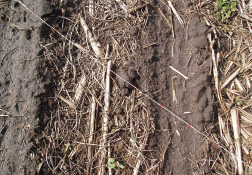
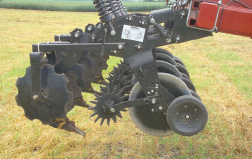
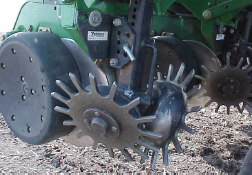
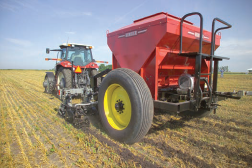
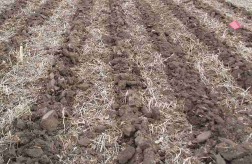
2. Strip tillage (Strip-till)
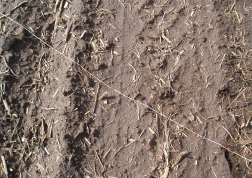
The strip-till system was relatively new in Minnesota at the time of these studies (Figures 3 to 5). Strip tillage creates a raised berm by tilling a zone 5 to 9 inches deep and 6 to 10 inches wide. It leaves the soil and residue undisturbed between the tilled zones.
Because it leaves more than 30 percent residue on the soil (averaged across tilled and untilled zones), it’s a conservation tillage system. Residue is removed from the tilled zone at the time of strip tillage and corn is planted into the residue-free area.
Advantages for fall strip tillage include better warm-up of soils and a mellow seed bed due to the freeze-thaw effect. While strip tillage is possible in the spring, the soil has less time to warm up prior to planting and the seedbed may be uneven. You can combine subsurface banding or zone incorporation of P and K fertilizer with fall or spring strip tillage in the same pass.
Strip-till implements used in these trials varied across farms, ranging from mole-knife with opening coulter and berm-shaping disks, to combinations of fluted coulters, to a large, toothed disk. All strip tillage was carried out in the fall.

3. Spring field cultivate (one-pass)
This study’s one-pass system (Figure 6) had no fall tillage and only a single pass in the spring with a field cultivator before planting. Using this system, fertilizer may be broadcast and incorporated with tillage or applied with the planter.
This system typically leaves about 30 percent residue cover after planting corn in a corn-soybean rotation, usually qualifying it as a conservation tillage system. We also refer to one-pass, along with strip-till, as reduced-tillage.
4. Chisel plow plus spring field cultivate (chisel-plow-plus)
The chisel-plow-plus system (Figure 7) is generally considered conventional tillage for corn following soybean on the poorly drained glacial till soils in Minnesota. Fertilizer may be broadcast and incorporated with tillage or applied with the planter. The soil warms up fast in the spring, but is left with less than 30 percent residue cover.
Rainfall and growing degree units during the trials
Climatic conditions varied across the state and between years during the study period. In 2004, cumulative growing degree units (GDU) were 5 to 10 percent below normal at three regional Research and Outreach Centers. Plus, precipitation ranged from 47 to 57 percent above normal for the months of May through September (Table 1).
In contrast, 2005 was an ideal year for crop growth. Precipitation was 28 to 53 percent above normal and GDUs were 10 percent above normal (Table 1). Crop producers experienced exceptional corn and soybean yields in 2005.
In addition to the cool and wet conditions in 2004, some western Minnesota producers experienced a very early frost on Aug. 21. The frost affected maturation, grain moisture and ultimately crop yields, especially at the Grant County site in west-central Minnesota where planting and harvest had been delayed.
Values in table 1 are for 2004 and 2005—both taken from May 1 to Sept. 30—at three regional Research and Outreach Centers in Minnesota.
Table 1: Precipitation and growing degree units (GDU)
| Region | 2004: Precipitation | 2004: Growing degree units | 2005: Precipitation | 2005: Growing degree units | 30-year normal: Precipitation | 30-year normal: Growing degree units |
|---|---|---|---|---|---|---|
| West Central ROC (Morris) | 24.89 inches | 2,327 GDUs | 24.31 inches | 2,751 GDUs | 15.85 inches | 2,348 GDUs |
| Southwest ROC (Lamberton) | 24.96 inches | 2,268 GDUs | 25.72 inches | 2,668 GDUs | 16.96 inches | 2,529 GDUs |
| Southern ROC Waseca | 3176 inches | 2,330 GDUs | 26.22 inches | 2,690 GDUs | 20.42 inches | 2,419 GDUs |
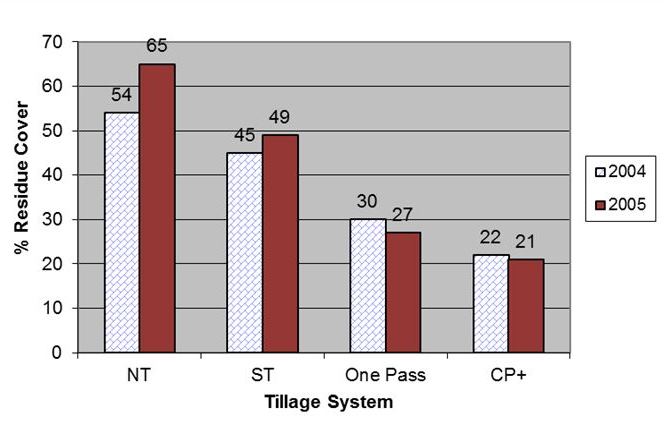
Residue counts were collected shortly after planting at each site. Average surface residue cover across sites in 2004 for the four tillage treatments was 54, 45, 30 and 22 percent for no-till, strip-till, one-pass and chisel-plow-plus, respectively (Figure 8 and Appendix Table 3).
Residue cover in 2005 was 65, 49, 27 and 21 percent for no-till, strip-till, one-pass and chisel-plow-plus, respectively (Figure 8 and Appendix Table 4).
On average, chisel-plow-plus left less than 30 percent residue after planting and, therefore, didn’t meet the federal standards for conservation tillage. On average, the one-pass tillage treatment just met the requirements in 2004 and was less than 30 percent in 2005.
Variation among sites
An analysis of 13 sites across both years showed residue cover varied considerably among sites. Residue cover percentages ranged from 30 to 90, 21 to 69, 11 to 54 and 4 to 44 percent for no-till, strip-till, one-pass and chisel-plow-plus, respectively (Appendix Tables 3 and 4).
Researchers attributed this variation among sites to the sites’ tillage history and the row spacing and dry matter production of the previous soybean crops.
Researchers took stand counts shortly after corn emergence at each location. Overall, plant populations were very similar among all tillage systems, with the average varying by only 600 plants per acre in 2004 and 1,800 plants per acre in 2005 (Table 2).
Values in table 2 are averaged across all sites in 2004 and 2005.
Table 2: Plant population for each tillage system
| Tillage treatments | Plant population: 2004 | Plant population: 2005 |
|---|---|---|
| No-till | 30,500 plants per acre | 29,900 plants per acre |
| Strip-till | 31,100 plants per acre | 31,200 plants per acre |
| One-pass | 31,000 plants per acre | 29,400 plants per acre |
| Chisel-plow-plus | 31,000 plants per acre | 29,700 plants per acre |
In 2004, only one location showed a statistical difference among tillage treatments (Appendix Table 5). At this site, strip-till had the highest plant population while no-till had the lowest.
In 2005, only one location had a statistical difference in plant population among treatments (Appendix Table 6). At this site, strip-till had the highest plant population while one-pass and chisel-plow-plus had the lowest populations. Plant population for strip tillage was never lower than conventional full-width tillage (one-pass or chisel-plow-plus) at any site.
Yield: 2004
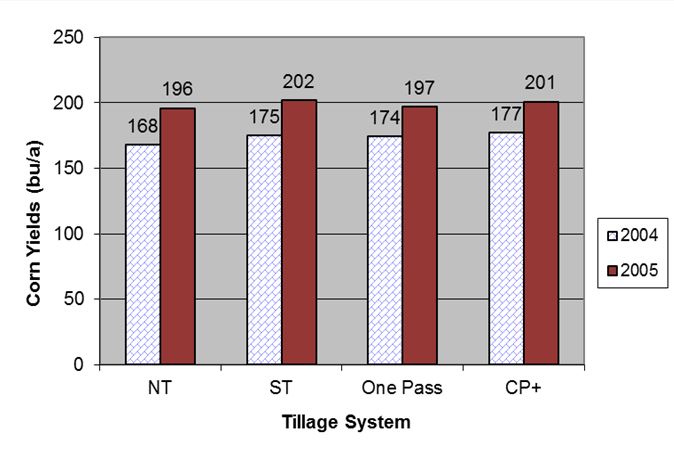
Corn grain yields were significantly affected by tillage treatments at six of the ten sites in the record cool growing season of 2004 (Appendix Tables 7 and 8). Averaged across the sites that used four tillage treatments, corn grain yields were, from smallest to largest (Figure 9 and Appendix Table 7):
No-till (167.8 bushels per acre).
One-pass (174.2 bushels per acre) and strip-till (174.6 bushels per acre).
Chisel-plow-plus (177.4 bushels per acre).
These data are very similar to results from 31 site-years of small plot research at the University of Minnesota’s Southern Research and Outreach Center in Waseca. They found chisel-plow-plus yielded 13 bushels per acre more than no-till, but only 3 and 4 bushels per acre greater than one-pass and strip-till, respectively.
At the three sites where only strip-till and chisel-plow-plus were compared in 2004, the chisel-plow-plus tillage treatment yielded 16 bushels per acre more than strip-till (Appendix Table 8). The unusually cool 2004 growing season undoubtedly affected the performance of this study’s three reduced-tillage systems.
Other research has shown that reduced-tillage systems can have significantly lower yields compared to conventional tillage in unusually cool or wet growing seasons, especially when using long-term, no-till or reduced-tillage systems. In the six sites in 2004 where chisel-plow-plus increased corn yields compared with strip-till, four of the six sites had a long-term, no-till or reduced-tillage history.
Yield: 2005
In contrast, corn yields weren’t significantly affected by tillage treatments at eight of nine sites in the warmer-than-normal 2005 growing season (Appendix Tables 9 and 10).
When averaged across the six sites with four tillage treatments (Figure 9 and Appendix Table 9), yields were:
No-till: 195.8 bushels per acre.
Strip-till: 202.2 bushels per acre.
One-pass: 196.5 bushels per acre.
Chisel-plow-plus: 200.5 bushels per acre.
These data show strip-till and chisel-plow-plus yielded significantly more than one-pass or no-till for corn. At the three sites where only strip-till and chisel-plow-plus were compared, there was no significant difference in yield (Appendix Table 10).
The 2005 trials demonstrated how reduced tillage systems, like strip-till, can produce excellent corn yields while maintaining adequate residue cover to protect the soil from erosion.
Yield average: 2004 and 2005
Corn yield averages across the 13 sites of 2004 and 2005 that compared all four tillage systems were:
Chisel-plow-plus: 190 bushels per acre.
Strip-till: 188 bushels per acre.
One-pass: 185 bushels per acre.
No-till: 180 bushels per acre.
In these studies, chisel-plow-plus and strip-till yields were statistically equal. These were significantly greater than one-pass yields and all tillage yields were greater than no-till yields.
As stated earlier, these data are quite similar to those found in small-plot tillage research averaged across years in Waseca, with little difference among the treatments that include some tillage.
Management tips for reduced-till systems
Tillage systems that leave more than 30 percent residue after planting corn work for many producers. However, you may need to adjust your management strategy throughout the whole cropping system, in addition to changing tillage implements.
Successful producers have made the following observations and suggestions:
Well-drained soil, either natural or artificial, is beneficial for enhanced yield performance in a reduced-tillage system.
Use chaff spreaders or choppers to evenly distribute chaff leaving the combine. This helps avoid planting or tilling through piles of residue.
Residue managers on the planter enhance early growth and promote uniform seed germination (Figure 10).
Use a heavy-duty, reduced tillage planter that’s capable of proper depth control and firm seed-to-soil contact for good germination.
Band-apply a starter fertilizer next to the corn row is good insurance against restricted root growth in cold, wet, fine-textured soils (Figure 11).
Band or inject nitrogen fertilizer, if possible, rather than broadcasting it.
Strip-tillage management tips
Match the strip-till toolbar’s width to that of the planter to ensure row alignment. Corn planted outside the strip is essentially no-till and may suffer in yield.
Auto-guidance systems can help ensure alignment of the planter on the strips.
In strip-till corn after corn, leave corn stubble standing for maximum air movement and less residue-matting, and build the strips between the previous crop rows.
Build strips in the fall rather than in the spring for the greatest soil warm-up and seed-to-soil contact.
In the cooler, fine-textured soils, strip tillage equipment should clear the berm to less than 10 percent residue for faster soil warm-up in the spring.
Build a high enough berm in the fall so that it’s at least 1 inch high by planting (Figure 12). If the tilled area is level or there’s a trough in the spring, the berm wasn’t high enough for rapid drying.
Band P and K fertilizer with the fall strip tillage pass to improve the economic advantages of strip-till. This reduces trips across the field and allows the lower rates recommended for banded versus broadcast application.
Appendix
Appendix Table 1: Individual site information by location for 2004
| County | Producer | Site coordinator |
|---|---|---|
| Blue Earth | Monsanto Farm | Bruce Drager, Monsanto Corp. |
| Cottonwood | Tom Muller | Dave Pfarr and Liz Stahl, University of Minnesota Extension |
| Fillmore | Steve Hafner | Bruce Drager, Monsanto Corp. |
| Grant | Mike Flint | Jodi DeJong-Hughes, Extension |
| Lac qui Parle | Jeff Olson | Harmon Wilts, Monsanto Corp. |
| Redwood | Ralph Weber | Randy Gettle, Monsanto Corp. |
| Sibley-1 | Todd Mesker | Dave Pfarr, Extension |
| Sibley-2 | Dan Pfarr | Dave Pfarr, Extension |
| Steams | Keith Landwehr | Dave Schwartz, Extension |
| Wabasha | Steve McNallen | Tim Wagar and Brad Carlson, Extension |
Appendix Table 2: Individual site information by location for 2005
| County | Producer | Site coordinator |
|---|---|---|
| Blue Earth | Monsanto Farm | Bruce Drager, Monsanto Corp. |
| Cottonwood | Tom Muller | Liz Stahl, Extension |
| Fillmore | Steve Hafner | Bruce Drager, Monsanto Corp. |
| Meeker | Keith Landwehr | Dan Martens and Dave Nicolai, Extension |
| Pope | Randy Reese | Jodi DeJong-Hughes, Extension |
| Redwood | Ralph Weber | Randy Gettle, Monsanto Corp. |
| Rice | Mark Bauer | Brad Carlson, Extension |
| Sibley-1 | Pete Kramer | Dave Pfarr, Extension |
| Sibley-2 | Todd Mesker | Dave Pfarr, Extension |
| Sibley-3 | Dan Pfarr | Dave Pfarr, Extension |
Shows effect of tillage treatments and previous crop tillage practices at the 2004 sites. Residue counts in Stearns and Cottonwood weren’t replicated.
Appendix Table 3: Residue cover after planting
| Tillage treatments | Stearns* (previous tillage: strip-till) | Grant (previous tillage: Fall chisel and spring cultivation) | Wabasha (previous tillage: No-till) | Sibley-1 (previous tillage: Fall ripped and spring cultivation) | Cottonwood* (previous tillage: No-till) | Sibley-2 (previous tillage:Fall ripped and spring cultivation | Average | Range |
|---|---|---|---|---|---|---|---|---|
| No-till | 65% residue | 56% residue | 42% residue | 30% residue | 90% residue | 43% residue | 54% residue | 30-90% residue |
| Strip-till | 34% residue | 68% residue | 42% residue | 23% residue | 60% residue | 41% residue | 45% residue | 23-68% residue |
| One-pass | 21% residue | 49% residue | 34% residue | 16% residue | 35% residue | 23% residue | 30% residue | 16-49% residue |
| Chisel-plow-plus | 7% residue | 39% residue | 22% residue | 14% residue | 35% residue | 14% residue | 22% residue | 7-39% residue |
| Least significant difference | -- | 7% residue | 6% residue | 4% residue | -- | 5 | -- | -- |
| (LSD) = 0.10 | -- | 7 | 6 | 4 | -- | 5 | -- | -- |
Shows residue values for treatments and previous crop tillage practices at the 2005 sites.
Appendix Table 4: Residue cover after planting as affected by tillage
| Tillage treatments | Sibley-1 (previous tillage: Fall ripped and spring cultivation) | Sibley-1 (previous tillage: Fall ripped and spring cultivation) Rice (previous tillage: No-till) | Sibley-2 (previous tillage: Ripped and cultivation) | Cottonwood (previous tillage: No-till) | Sibley-3 (previous tillage: Ripped and cultivation) | Meeker (previous tillage: Chisel) | Pope (previous tillage: No-till) | Average | Range |
|---|---|---|---|---|---|---|---|---|---|
| No-till | 47% residue | 68% residue | 60% residue | 88% residue | 69% residue | 42% residue | 80% residue | 65% residue | 42-88% residue |
| Strip-till | 36% residue | 45% residue | 50% residue | 69% residue | 59% residue | 21% residue | 65% residue | 49% residue | 21-69% residue |
| One-pass | 17% residue | 32% residue | 23% residue | 54% residue | 20% residue | 11% residue | 35% residue | 27% residue | 11-54% residue |
| Chisel-plow-plus | 11% residue | 22% residue | 22% residue | 44% residue | 11% residue | 4% residue | 30% residue | 21% residue | 4-44% residue |
| LSD (0.10) | 5 | 6 | 8 | 9 | 4 | 14 | 4 | -- | -- |
Note plant population counts weren’t replicated in Stearns or Grant.
Appendix Table 5: Plant populations as affected by tillage treatments in 2004
| Tillage treatments | Stearns | Grant | Sibley-1 | Wabasha | Sibley-2 | Average |
|---|---|---|---|---|---|---|
| No-till | 30,000 plants per acre | 34,700 plants per acre | 31,100 plants per acre | 28,000 plants per acre | 28,500 plants per acre | 30,500 plants per acre |
| Strip-till | 31,200 plants per acre | 35,000 plants per acre | 31,300 plants per acre | 28,100 plants per acre | 30,000 plants per acre | 31,100 plants per acre |
| One-pass | 31,100 plants per acre | 34,200 plants per acre | 31,100 plants per acre | 29,7000 plants per acre | 28,800 plants per acre | 31,000 plants per acre |
| Chisel-plow-plus | 30,600 plants per acre | 35,400 plants per acre | 30,500 plants per acre | 28,900 plants per acre | 29,600 plants per acre | 31,000 plants per acre |
| LSD (0.10) | -- | -- | NS | NS | 0.8 | -- |
Appendix table 6: Plant populations as affected by tillage treatments in 2005
| Tillage treatments | Sibley-1 | Rice | Sibley-2 | Cottonwood | Sibley-3 | Meeker | Pope | Average |
|---|---|---|---|---|---|---|---|---|
| No-till | 31,200 plants per acre | 27,300 plants per acre | 32,500 plants per acre | 30,100 plants per acre | 28,700 plants per acre | 33,300 plants per acre | 26,500 plants per acre | 29,900 plants per acre |
| Strip-till | 32,000 plants per acre | 31,300 plants per acre | 32,700 plants per acre | 31,400 plants per acre | 30,300 plants per acre | 32,800 plants per acre | 27,800 plants per acre | 31,200 plants per acre |
| One-pass | 31,500 plants per acre | 26,200 plants per acre | 31,000 plants per acre | 29,000 plants per acre | 26,500 plants per acre | 32,500 plants per acre | 29,000 plants per acre | 29,400 plants per acre |
| Chisel plow+ | 32,300 plants per acre | 29,300 plants per acre | 31,700 plants per acre | 26,400 plants per acre | 27,500 plants per acre | 32,800 plants per acre | 28,000 plants per acre | 29,700 plants per acre |
| LSD (0.10) | NS | NS | NS | NS | 2.2 | NS | NS | -- |
Appendix Table 7: Grain yields as affected by tillage treatments in 2004
| Tillage treatments | Corn grain yield: Stearns | Corn grain yield: Grant | Corn grain yield: Wabasha | Corn grain yield: Sibley-1 | Corn grain yield: Cottonwood | Corn grain yield: Sibley-2 | Corn grain yield: Blue Earth | Average corn grain yield |
|---|---|---|---|---|---|---|---|---|
| No-till | 182.2 bushels per acre | 115.7 bushels per acre | 184.7 bushels per acre | 198.0 bushels per acre | 128.6 bushels per acre | 192.2 bushels per acre | 173.4 bushels per acre | 167.8 bushels per acre |
| Strip-till | 187.6 bushels per acre | 116.3 bushels per acre | 183.2 bushels per acre | 196.2 bushels per acre | 136.9 bushels per acre | 204.1 bushels per acre | 198.1 bushels per acre | 174.6 bushels per acre |
| One-pass | 186.6 bushels per acre | 116.7 bushels per acre | 181.8 bushels per acre | 199.1 bushels per acre | 134.3 bushels per acre | 201.0 bushels per acre | 200.2 bushels per acre | 174.2 bushels per acre |
| Chisel-plow-plus | 183.5 bushels per acre | 123.8 bushels per acre | 168.7 bushels per acre | 201.4 bushels per acre | 144.7 bushels per acre | 208.7 bushels per acre | 211.2 bushels per acre | 177.4 bushels per acre |
| LSD (0.10) | NS | 2.9 | NS | NS | 5.3 | 5.3 | 6.3 | 2.6 |
Values are for three sites in 2004.
Appendix Table 8: Grain yields as affected by tillage treatments (2004)
| Tillage treatments | Corn grain yield: Redwood | Corn grain yield: Fillmore | Corn grain yield: Lac que Parle | Average corn grain yield |
|---|---|---|---|---|
| Strip-till | 176.4 bushels per acre | 190.9 bushels per acre | 140.4 bushels per acre | 169.2 bushels per acre |
| Chisel-plow-plus | 202.0 bushels per acre | 201.9 bushels per acre | 153.2 bushels per acre | 185.7 bushels per acre |
| LSD (0.10) | NS | 6.1 | 6.8 | 9.3 |
Values are for six sites in 2005. Note that Sibley-2 was lost due to wind damage.
Appendix Table 9: Grain yields as affected by tillage treatments (2005)
| Tillage treatments | Corn grain yield: Sibley-1 | Corn grain yield: Rice | Corn grain yield: Cottonwood | Corn grain yield: Sibley-3 | Corn grain yield: Meeker | Corn grain yield: Pope | Average corn grain yield |
|---|---|---|---|---|---|---|---|
| No-till | 226.0 bushels per acre | 181.6 bushels per acre | 179.0 bushels per acre | 190.3 bushels per acre | 201.4 bushels per acre | 196.7 bushels per acre | 195.8 bushels per acre |
| Strip-till | 230.5 bushels per acre | 188.0 bushels per acre | 186.5 bushels per acre | 197.6 bushels per acre | 210.0 bushels per acre | 200.6 bushels per acre | 202.2 bushels per acre |
| One-pass | 225.7 bushels per acre | 171.0 bushels per acre | 181.1 bushels per acre | 184.3 bushels per acre | 210.8 bushels per acre | 205.8 bushels per acre | 196.5 bushels per acre |
| Chisel-plow-plus | 227.3 bushels per acre | 189.5 bushels per acre | 181.4 bushels per acre | 195.6 bushels per acre | 205.0 bushels per acre | 204.4 bushels per acre | 200.5 bushels per acre |
| LSD (0.10) | NS | 7.7 | NS | NS | NS | NS | 3.8 |
Values are for three sites in 2005.
Appendix Table 10: Grain yields as affected by tillage treatments (2005)
| Tillage treatments | Tillage treatments Corn grain yield: Redwood | Corn grain yield: Faribault | Corn grain yield: Fillmore | Corn grain yield: Average |
|---|---|---|---|---|
| Strip-till | 223.2 bushels per acre | 224.0 bushels per acre | 214.2 bushels per acre | 220.5 bushels per acre |
| Chisel-plow-plus | 220.7 bushels per acre | 22.5 bushels per acre | 215.0 bushels per acre | 219.4 bushels per acre |
| LSD (0.10) | NS | NS | NS | NS |
Al-Kaisi, M.M. & Hanna, M. (2002). Consider the strip-tillage alternative (Iowa State University Extension publication PM 1901c).
Hill, P.R. (1998). Fall strip-till systems for corn production: Results from Monsanto's Center of Excellence, 1999 No-Till Farmer Conference.
Randall, G.W. & Vetsch, J.A. (2005). Optimum tillage systems for corn and soybean production and water quality protection in south-central Minnesota-Minnesota River Basin (University of Minnesota Extension publication BU-08315).
Randall, G.W., Wager, T. L., Senjem, N.B., Busman, L.M. & Moncrief, J.F. (2002). Tillage best management practices for water quality protection in Southeastern Minnesota (University of Minnesota Extension publication BU-07694).
Randall, G.W., & Hill, P. R. (2000). Chapter 23: Fall strip-tillage systems. Conservation Tillage Systems and Management (2nd ed.). MidWest Planning Service.
Randall, G.W., Lueschen, W.E., Evans, S.D., & Moncrief, J.F. (1996). Tillage best management practices for corn-soybean rotations in the MN River basin (University of Minnesota Extension publication FO-6676).
Senjem, N.B., Moncrief, J.F., Randall, G.W. & Evans, S.D. (1996). Sediment problems and solutions for the Minnesota River (University of Minnesota Extension publication FO-6671).
Reviewed in 2018