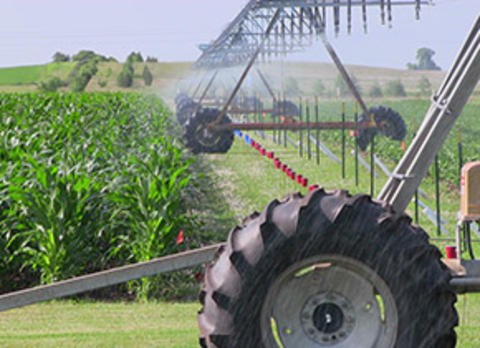
Identifying water application problems when irrigating using a sprinkler irrigation system, such as center pivots, is vital.
Over and under irrigation can have an adverse effect on crop yield that can be attributed to poor soil aeration, increased disease incidence and leaching of the agricultural chemicals to the groundwater especially in sandy soils, which are highly porous and cannot hold much water.
Consequently, periodic checking of irrigation system uniformity is important and is the first step in improving water use efficiency and yield and reducing the energy costs.
Test procedure
Uniformity testing can be done by setting the catch cans (collectors) along the length of the pivot or perpendicular to the direction of the travel and letting the system pass over these cans.
- The system pressure should match the pressure used to design the sprinkler package on the machine.
- Record the amount of water collected in each can and can distance from the center of the pivot.
- Using this information, a coefficient of uniformity (CU) can be calculated.
- The coefficient of uniformity (CU) is usually expressed as a percentage.
The formulas and interpretation of CU are discussed in the later section. The step by step procedure is described below:
Before conducting a uniformity testing it is important to verify that correct sprinklers are installed, and are installed at the right place. This can be done by verifying that each sprinkler is installed as the sprinkler package printout supplied by the vendor.
If sprinklers are not installed as they are on the sprinkler package printout, it can reduce the application uniformity substantially. So if it is found that the sprinkler package is not installed or adjusted properly, it should be corrected before performing the test.
Set out the identical and symmetrical collector cans that are at least 5 inches (120 mm) high and at least 2.5 inches (60 mm) in diameter along one or more parallel lines to the center pivot.
The collection cans should be uniformly spaced and spacing between the two cans should not be more than 10 feet (3 m) when spray devices are used and 16 feet (5 m) when impact sprinklers are used. The closer the cans, the more accurate the representation of the uniformity.
If you are performing the test after the crop has emerged, cans should be placed at some height, so they are above the crop growth and they do not tip over. According to the ANSI/ASAE S436.1 DEC01 standard, the test should be performed with the end gun in the same operational mode as used for designing the sprinkler package (on or off). If end gun is on, place the collector cans at least 150 feet past the end gun.
After placing the cans, operate the sprinkler system over the cans at the normal operating pressure. The speed of the machine should be such that it delivers an average depth of application of not less than 0.60 inches.
Record the water in the can by measuring the volume of water in the can. This can be done by pouring the water into a volumetric cylinder. The excel spread sheet (link provided below) can be used to convert the volume of water in milliliters to the depth of water in inches.
Enter the data collected in the field into the Excel spreadsheet to calculate the Coefficient of Uniformity (CU). The data collection sheet provided in the excel spreadsheet can be printed out to record the data in the field.
Disregard the data collected from the cans at the end of the system in which the volume of water collected is very low. Also, the data collected under the first 12 percent of the center pivot (not exceeding 250 feet) can be left out of the analysis.
How to analyze and interpret your data
Use the Center pivot application uniformity spreadsheet to calculate the coefficient of uniformity (CUH).
The coefficient of uniformity (CUH) for the center pivot system is calculated using the modified formula of Heermann and Hein:
where CUH is the Heerman and Hein uniformity coefficient;
N in the number of collector cans;
i is the ith can from the pivot point with i=1 being the can closest to the pivot;
Si is the distance of the ith can from the center of the pivot; Vi is the volume of water collected in the ith can; and
Vp is the weighted average of the volume of water caught. It is calculated with the following:
Interpreting your results
Once you've calculated the uniformity coefficient, check the table below to see if you need to take additional actions.
Uniformity coefficient interpretation.
| Uniformity coefficient | Interpretation |
|---|---|
| 90-100% | Excellent; no changes are required |
| 85-90% | Good; no changes are required |
| 80-85% | Fair; no changes required at this time, but the system should be monitored closely |
| Below 80% | Poor; improvements are required |
Additional tips
- Finding a kit: Irrigation uniformity testing kits are usually available to check-out at your local Natural Resource Conservation Service (NRCS) and Soil and Water Conservation District (SWCD) offices. Their staff may also help you perform the test and calculations. If you do not have access to a testing kit, 16-ounce drink cups, rain gauges or other containers of uniform size and shape may be used to perform a uniformity test.
- Note any issues: It is very important to make notes of any leaks or if some sprinklers are not operating properly. These notes can help you interpret the data and make recommendations for improvements.
- Wind speed: The test should not be performed if wind speeds exceed 2.25 miles per hour. Tests are invalid if winds are greater than 11 mph. To minimize the effect of evaporation, perform the test at night or during early daylight hours.
Watch this video to see a test being performed: Irrigation uniformity testing
Reviewed in 2019


