

Soil is a plant’s water reservoir. This reservoir has upper and lower limits of how much water it can store for crop water use. Understanding different water thresholds in the soil-water reservoir is important for irrigation scheduling.
Irrigation scheduling
To set up and operate an effective irrigation scheduling program, these sequenced procedures need to be followed for each field:
- Determine the crop’s active rooting depth and the corresponding available water-holding capacity for each soil type in the field.
- Select the predominant soil type(s) that should be used for irrigation water management purposes.
- Define the management allowable soil water depletion (MAD) limits for the selected soil types and the crop(s) to be grown.
- Establish a soil moisture monitoring system and regularly (at least twice a week) keep track of the soil water deficit or depletion.
- Initiate an irrigation when the soil water deficit is expected to approach the selected management allowable soil water depletion limit by the time the irrigation cycle is completed.
This procedure typically takes 5 to 20 minutes daily to keep updated after determining the initial soil water characteristics. If operator time is not available to regularly monitor and estimate soil moisture, a crop consultant can help you achieve your management objectives and adopt advanced cellular telemetry irrigation management options.
Terms to describe water thresholds
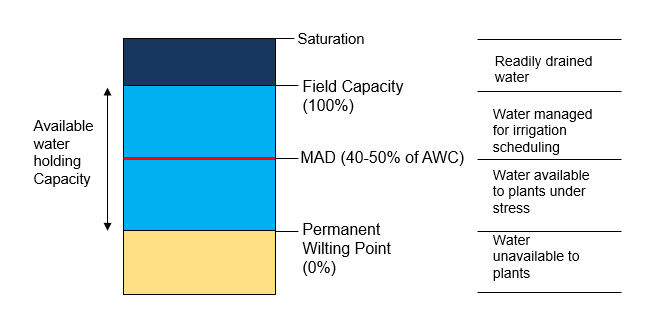
Saturation
All soil pores are filled with water, and water readily percolates or drains from the root zone by gravitational force.
Field capacity (FC)
The amount of water remaining in the soil after all excess water at saturation has been drained.
Usually, when sandy soils are allowed to drain for approximately 24 hours after saturation, field capacity is reached. In heavier textured soils that have more silt and clay, it takes 2 to 3 days after saturation to reach field capacity.
Permanent wilting point (PWP)

When plants take up all the available water for a given soil, the soil dries to a point that it cannot supply any water to keep plants from dying.
Available water holding capacity (AWC)

The maximum amount of water that soil can store to be extracted by the plants. It is the water held between the field capacity and the permanent wilting point.
The total available water in the soil root zone for a specific crop is equal to the crop’s rooting depth multiplied by the available water-holding capacity per unit depth of the soil.
Different soil types have different available water-holding capacities.
For example, coarse soils, such as sands and sandy loam, have relatively large pores compared to a finer-textured soil such as clay. Fine soils, like clays or clay loams, have small mineral particles and very small pores.
Having a larger number of small pores means a fine-textured soil can hold more water than a coarse-textured soil.
Get a detailed look at your field’s soil using the Web Soil Survey from the USDA.
The following tables show AWC across different soil textures and provide examples of the available water-holding capacity for two typical irrigated soils.
Available water capacity (AWC) by soil texture
| Texture | AWC range (in/in) | AWC range (in/ft) | Est. typical AWC (in/ft) |
|---|---|---|---|
| Coarse sand | 0.01-0.03 | 0.1-0.4 | 0.25 |
| Sand | 0.01-0.03 | 0.1-0.4 | 0.25 |
| Fine sand | 0.05-0.07 | 0.6-0.8 | 0.75 |
| Very fine sand | 0.05-0.07 | 0.6-0.8 | 0.75 |
| Loamy coarse sand | 0.06-0.08 | 0.7-1.0 | 0.85 |
| Loamy sand | 0.06-0.08 | 0.7-1.0 | 0.85 |
| Loamy fine sand | 0.09-0.11 | 1.1-1.3 | 1.25 |
| Loamy very fine sand | 0.10-0.12 | 1.0-1.4 | 1.25 |
| Coarse sandy loam | 0.10-0.12 | 1.2-1.4 | 1.3 |
| Sandy loam | 0.11-0.13 | 1.3-1.6 | 1.45 |
| Fine sandy loam | 0.13-0.15 | 1.6-1.8 | 1.7 |
| Very fine sandy loam | 0.15-0.17 | 1.8-2.0 | 1.9 |
| Loam | 0.16-0.18 | 1.9-2.2 | 2 |
| Silt loam | 0.19-0.21 | 2.3-2.5 | 2.4 |
| Silt | 0.16-0.18 | 1.9-2.2 | 2 |
| Sand clay loam | 0.14-0.16 | 1.7-1.9 | 1.8 |
| Clay loam | 0.19-0.21 | 2.3-2.5 | 2.4 |
| Silty clay loam | 0.19-0.21 | 2.3-2.5 | 2.4 |
| Sandy clay | 0.15-0.17 | 1.8-2.0 | 1.9 |
| Silty clay | 0.15-0.17 | 1.8-2.0 | 1.9 |
| Clay | 0.14-0.16 | 1.7-1.9 | 1.8 |
Source: Chapter 2 “Soils”, Irrigation Guide, Natural Resources Conservation Service- National Engineering Handbook
Available water capacity (AWC) of a Renshaw soil series
| Profile depth (in.) | Texture class | AWC per inch (in.) | AWC per zone (in.) | AWC cumulative |
|---|---|---|---|---|
| 0-12 | Loam | 0.21 | 2.52* | 2.52 |
| 12-18 | Sandy loam | 0.16 | 0.96 | 3.48 |
| 18-60 | Sand and gravel | 0.02 | 0.84 | 4.32 |
*Calculated by multiplying 12 inches x 0.21 inches per inch = 2.52 inches
Available water capacity (AWC) of a Hubbard soil series
| Profile depth (in.) | Texture class | AWC per inch (in.) | AWC per zone (in.) | AWC cumulative |
|---|---|---|---|---|
| 0-12 | Sand | 0.09 | 1.08 | 1.08 |
| 12-24 | Sand | 0.06 | 0.72 | 1.8 |
| 24-36 | Sand | 0.06 | 0.72 | 2.52 |
| 36-60 | Sand | 0.06 | 1.44 | 3.96 |
Maximum allowable depletion or deficit (MAD)
Maximum allowable depletion (also called "management allowed depletion" or MAD) specifies the maximum amount of soil water the irrigation manager allows the crop to extract from the active rooting zone between irrigations. Only a portion of the available water-holding capacity is easily used by the crop before crop water stress develops. A soil’s MAD is less than its total AWC.
Historically, irrigations have been planned to prevent the soil water deficit from exceeding 50 percent of the total available water capacity in the rooting zone. But research shows that the depletion limit can be adjusted to optimize the field's production depending on the crop, stage of growth, soil water capacity, and the irrigation system's pumping capacity.
MAD is usually expressed as a percentage of the total available water capacity in the rooting zone. It needs to be converted to inches of soil water for a specific crop and soil situation. To convert depletion percentage to inches of water, multiply the given depletion percentage by the total available water in the root zone.
For example, if a 30 percent depletion limit is desired for a soil holding 3.50 inches of water, the depletion level in inches of soil water would be 1.05 inches:
.30 x 3.50 inches = 1.05 inches
See management guidelines for developing a management plan and setting maximum allowable depletion (MAD) limits.
The following table lists recommended maximum allowable soil water depletion limits and management strategies for several irrigated crops grown in Minnesota. These recommendations resulted from several research projects in the North Central states and published guidelines from other states.
Recommended allowable soil moisture depletion limits for crops by growth stage
| Crop | Growth stage | MAD (%) |
|---|---|---|
| Corn | Emergence1-12 leaf (V12) 12 leaf-Pollination Pollination-Early dent Maturity |
60-70 40-50 50 60-70 |
| Potatoes | Emergence1-Tuber yield Tuber yield-Formation initiation Formation initiation-Bulking Ripening period |
40-60 30-40 30-40 40-65 |
| Soybeans | Emergence1-Beginning flower Beginning flower-Beginning pod Beginning pod-Full pod Maturity |
65-70 60-65 50 50-70 |
| Edible beans | Emergence1-Auxiliary budding Auxiliary budding-Beginning flower Flowering-Full pod Maturity |
60-70 60 50 50-70 |
| Small grain | Emergence1-First node First node-Flowering Flowering-Milk Maturity |
60 40-50 40 50-70 |
1Consider 10% depletion at the seed germination zone.
Source: adapted from the results of several research projects in the North-Central states and published guidelines from other states (Dorn et al., 1989— Nebraska; Stegman, 1988— North Dakota; Fishbach et al., 1988— Nebraska; Curwen et al., 1985— Wisconsin; Al-Kaisi et al., 2014).
Soil water deficit
This is the amount of water removed by the crop from the active rooting depth. Likewise, it is the amount of water required to refill the root zone to bring the current soil moisture conditions to field capacity.
Soil water decreases as the crop uses water (evapotranspiration) and increases as precipitation (rainfall or irrigation) is added. Expressed in soil water deficit, evapotranspiration increases the deficit, and precipitation decreases it. It is usually expressed in inches of water and can be estimated or measured by several methods described in other sections.
For irrigation scheduling, whenever the soil water deficit is equal to or higher than MAD, irrigation should be triggered. Irrigation amounts should refill the rooting zone to field capacity while also leaving some room for possible precipitation.
Crop rooting depth

Crop rooting depth determines how much soil water crops can access. A shallow-rooted crop has less access to soil water than a deep-rooted crop.
However, because most of a plant’s roots are located in the upper portion of the root zone, irrigation water applications are generally managed to a shallower depth than the crop’s full rooting depth. For annual crops, this rooting depth isn’t usually achieved until 30 to 50 days after planting. Note that local soil and climatic conditions may reduce these values.
The following table lists suggested rooting depths for irrigation water management of commonly irrigated crops in Minnesota. Each crop can potentially develop a greater rooting depth.
Crop rooting depth for irrigation water management
| Crop | Depth (inches) |
|---|---|
| Alfalfa (established) | 48 |
| Corn, sugarbeet | 36 |
| Potato, small grain | 24 |
| Soybean, field bean | 24 |
| Tomato, muskmelon | 12-24 |
| Broccoli, cauliflower | 12-18 |
| Blueberry, strawberry | 12-18 |
Extension resources
- Irrigation management strategies
- Soil moisture sensors for irrigation scheduling
- Evapotranspiration-based irrigation scheduling or water-balance method
- Estimating soil moisture by feel method
- Irrigation scheduling checkbook method
- Late-season irrigation
- Variable Rate Irrigation
The Irrigation Management Assistant (IMA) helps Minnesota growers improve irrigation efficiency across a variety of crops, including corn, soybean, potato, and other irrigated crops. The tool works best when using precipitation data near your field and is optimized for Minnesota conditions.
Al-Kaisi, M.M, I. Broner and A.A. Andales. 2014. Crop water use and growth stages. Colorado State University Extension. Fact sheet no. 4.715.
Curwen, D. and L. Massie. 1985. WISP—The Wisconsin Irrigation Scheduling Program. Proceedings of the National Conference on Advances in Evapotranspiration. American Society of Agricultural Engineers. Michigan.
Dorn, D. Eisenhauer, and P. Fischbach. 1989 Irrigation Scheduling Using Tensiometers in Sandy Soils. Irrigation Short Course Proceedings, Cooperative Extension Service University of Nebraska.
Fischbach, P.E. (editor) 1988. Irrigation Scheduling—Management Handbook. Cooperative Extension Service, University of Nebraska.
Stegman, E.C. 1988. Chapter V. Water Management. Best Management Practices Manual for Oakes Irrigation Area. North Dakota State University.
Reviewed in 2026